
If you’ve ever shopped for a high-speed USB-C, HDMI 2.1, or Thunderbolt cable, you’ve probably stumbled across terms like “eye diagram testing,” “eye height,” or “eye width” on product spec sheets or third-party test reports. Some brands even lead with a wide-open eye diagram screenshot as proof their cable delivers top-tier performance. But what exactly is an eye diagram? And can one single image tell you everything you need to know about a cable’s quality?
From casual shoppers picking out cables, procurement teams running acceptance checks, to R&D engineers debugging high-speed links, eye diagrams are one of the most widely used signal integrity analysis tools. This guide starts with foundational concepts and covers core eye diagram parameters, standardized testing workflows, report interpretation, and troubleshooting frameworks for common products including USB, HDMI, Ethernet cables, and active optical cables (AOCs). Whether you’re a complete beginner or a professional looking to fill knowledge gaps, you’ll find actionable, accurate information here.
Core Eye Diagram Parameters: How to Read Eye Height, Eye Width, Jitter, and Masks
Don’t get intimidated by a dense, line-filled eye diagram – focus on a handful of core parameters to understand what it’s telling you. Important caveat: Definitions, calculation methods, statistical confidence, and measurement bandwidth requirements for eye height, eye width, jitter, and mask margin all follow the relevant protocol specification and test software settings. Parameters with the same name from different standards are not directly comparable.
Shape and Margin
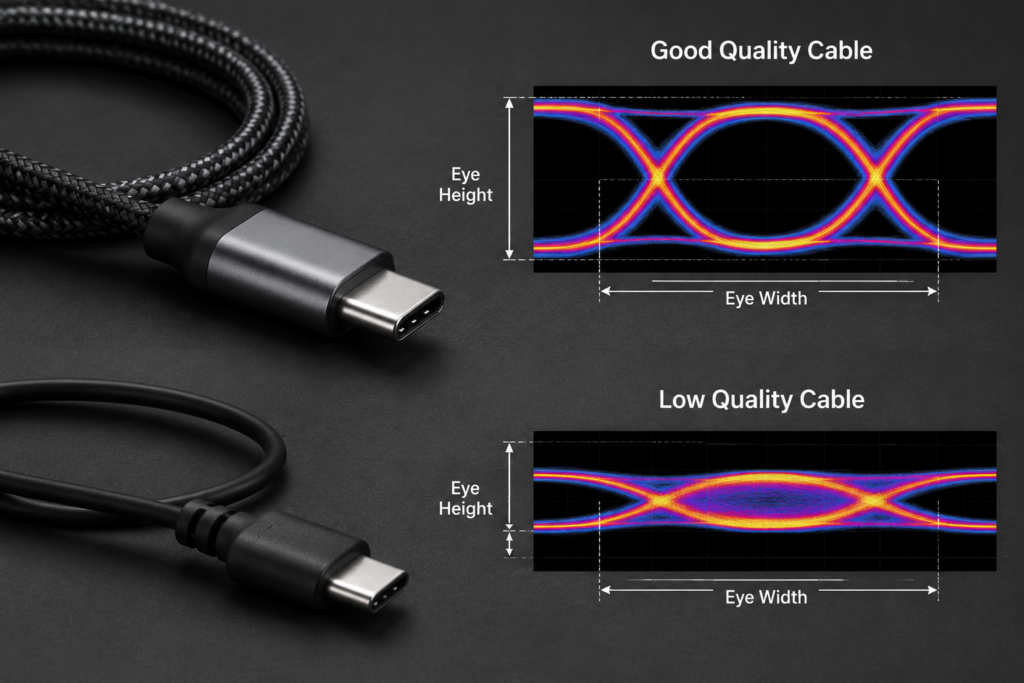
The most intuitive metric is the size of the “eye” opening, measured by two key values:
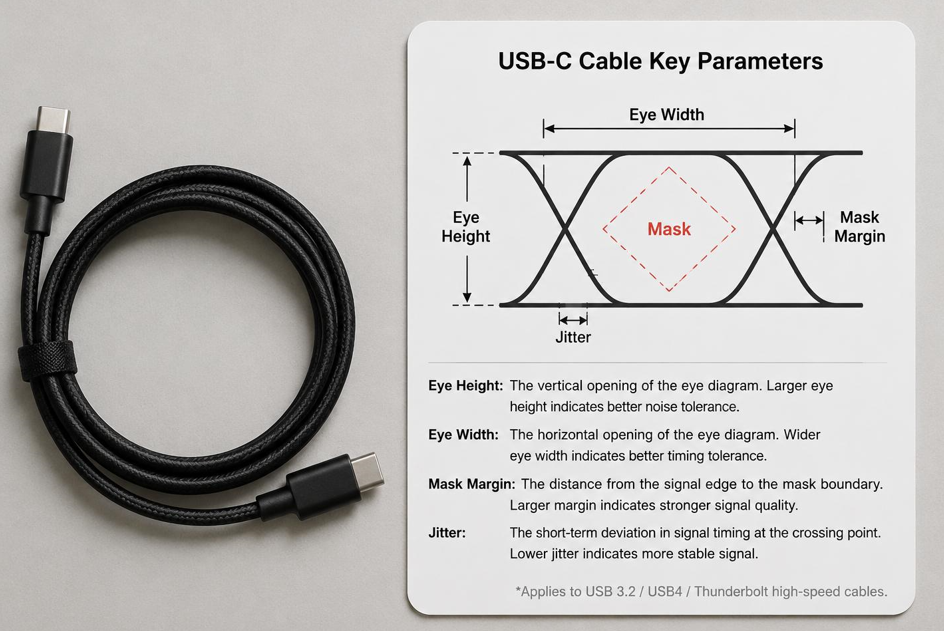
- Eye Height: The vertical opening of the sampling window, reflecting signal amplitude margin. Under the same protocol and test conditions, higher eye height means better resistance to voltage noise, and lower risk of misinterpreting a 0 as a 1 (or vice versa) from level fluctuations.
- Eye Width: The horizontal opening of the sampling window, reflecting signal timing margin. Under the same protocol and test conditions, wider eye width means better resistance to timing jitter, and lower risk of bit errors from timing offset.
Other common shape parameters include:
- Crossover Point: Where the rising and falling edges of the eye cross. Ideally, this sits at the midpoint of the full signal amplitude; the crossover percentage is how far up the amplitude range this point falls.
- Level Distribution: How tightly concentrated each signal level is in the eye diagram. Tighter distribution means a more stable signal.
One critical concept is the eye diagram mask (mask test). The mask is a “no-go zone” defined by the relevant protocol. If any part of the eye diagram touches the mask, the signal fails the spec. A key note: Masks are tied to a specific protocol, data rate, test point, and measurement condition. For example, a USB 3.2 Gen2 mask is completely different from an HDMI 2.1 mask – even source-side and receiver-side tests for the same protocol use different masks.
Many brands market claims like “our mask margin is 20%, so performance is excellent.” But mask margin is simply the distance between the measured eye and the mask boundary. There is no universal “10% = passing, 20% = excellent” rule – some protocols pass with 5% margin, others require 20% or more. Always cross-reference against the specific protocol specification.
Jitter, Noise, and Intersymbol Interference
If eye height and eye width are the end results, jitter and noise are the key underlying causes.
Jitter refers to signal edges shifting left and right away from their ideal timing position. It is split into two main categories by source:
- Random Jitter (RJ): Unpredictable jitter caused by factors like thermal noise. It is always present – you can reduce it but never eliminate it entirely, and it follows a Gaussian distribution.
- Deterministic Jitter (DJ): Jitter with a consistent, identifiable cause, like crosstalk, reflections, power supply noise, or duty cycle distortion. Once you find the source, you can usually optimize to reduce it.
Combined, these make Total Jitter (TJ), which compresses the horizontal eye opening and reduces timing margin. But actual bit error risk also depends on the protocol’s defined sampling point location, receiver threshold, equalization settings, and formal BER test results.
Noise is vertical signal fluctuation, which thickens eye edges and reduces eye height. Besides noise, intersymbol interference (ISI) – when the tail of one symbol bleeds into the next – shrinks both the vertical and horizontal eye opening.
Eye opening correlates with Bit Error Rate (BER), and a common related analysis tool is the bathtub curve: the horizontal axis plots sampling time/phase offset, and the vertical axis plots BER/error probability. Typically, BER is lowest in the center of the sampling window and rises near the signal edges, though exact curve shape varies by standard definition, plotting method, and link characteristics. Wider eye width usually means a wider stable sampling window, but final BER performance must be confirmed with formal BER testing.
Reminder: Different standards define jitter, noise, and measurement bandwidth differently – never directly compare jitter values from two different test standards.
NRZ, PAM3, and PAM4 Eye Diagrams
If you see an eye diagram with multiple stacked “eyes,” that’s just a different signal encoding scheme. Three common types:
- NRZ (Non-Return-to-Zero): The traditional encoding scheme, with only high and low two levels representing 1 and 0, so the eye diagram has one main opening. Most legacy high-speed serial links use NRZ, including USB 3.x, HDMI 2.0, and PCIe 5.0.
- PAM3 (Pulse Amplitude Modulation 3-level): A three-level signal with three distinct voltage/optical power levels representing three symbol states. Ideally, the eye diagram has two openings. Exact eye structure, symbol mapping, and measurement metrics are defined by the relevant protocol – you can’t derive all test requirements just from the number of levels. USB4 v2 uses PAM3 to boost transfer rates, for example.
- PAM4 (Pulse Amplitude Modulation 4-level): A four-level signal with four levels representing four states (each symbol carries 2 bits), so the eye diagram has three openings. Newer high-speed links like PCIe 6.0 and 100G+ Ethernet physical layers use PAM4, because at the same symbol rate, PAM4 delivers twice the bit rate of NRZ with lower channel bandwidth requirements. The tradeoff? It’s more sensitive to noise, since the spacing between levels is smaller.
A real-world example: PCIe 5.0 uses 32GT/s NRZ encoding, while PCIe 6.0 upgrades to 64GT/s PAM4 – double the data rate, but with a completely different encoding scheme, test methods, and metrics. USB4 v1 and USB4 v2 also use different signaling, so you can’t mix up their eye diagram interpretations – always confirm the protocol version and encoding first.
For PAM4 eye diagrams, in addition to per-eye height and width, you’ll also look at specialized metrics like level linearity and TDECQ (Transmitter and Dispersion Eye Closure for Quaternary, a standard PAM4 transmitter quality metric). Exact requirements always follow the relevant protocol spec.
Optical vs. Electrical Eye Diagrams
There are two types of eye diagrams, with completely different test targets and metrics:
- Electrical Eye Diagrams: Used for electrical signal links, like copper cables and electrical port transceivers. Key metrics include voltage amplitude, timing, jitter, and mask margin.
- Optical Eye Diagrams: Used for optical transmitters or active optical links, like the transmitter side of optical transceivers and the optical ports of AOCs. Key metrics include optical power, level, extinction ratio (the ratio of high-level to low-level optical power, which must fall within the standard’s acceptable range – both too high and too low can hurt link performance, and it should be evaluated alongside average optical power, optical modulation amplitude, rise/fall time, and other parameters), rise/fall time, and optical modulation amplitude.
Repeat note: Passive fiber patch cords don’t generate light, so optical eye diagram performance is heavily tied to the transmitter’s capabilities. Never judge a passive fiber cord’s quality solely by an optical eye diagram – always combine it with insertion loss, return loss, and end face inspection.
Standardized Testing Workflow: How Is an Eye Diagram Measured?
The same cable can produce wildly different eye diagram results when tested by different people, because eye diagrams are extremely sensitive to test conditions. Only results measured with a standardized workflow have real reference value.
First, Confirm Test Boundaries
Before you look at any eye diagram, clarify the test boundary conditions – otherwise the result is meaningless:
- Confirm the protocol, version, data rate, generation, cable length, connector type, and test point (source side, load side, mid-channel, etc.).
- Distinguish whether the result is for the raw cable (with fixture and adapter effects removed via de-embedding), the end-to-end channel, or the full system link (including transmitter and receiver equalization).
- Confirm the test goal: R&D troubleshooting, production spot check, customer acceptance, or official certification? Each goal has a different level of test rigor.
How Regular Users Can Spot a Trustworthy Test Report
When shopping for high-speed cables, you’ll often see brands include eye diagram test reports. How do you tell if a report is legitimate and not inflated? Check these 6 things:
- Clear basic information: Does it list the protocol version, data rate, sample length, and test point? A report that just says “HDMI eye diagram pass” without specifying HDMI 2.0 vs 2.1, or 1m vs 5m length, has almost no value.
- Correct standard test methods: Does it use the corresponding protocol’s mask, test pattern, and pass/fail criteria? Some brands test high-speed cables against low-speed protocol masks, which will always pass.
- Documented test equipment and calibration status: Does it list the instrument model, bandwidth, probe/fixture model, calibration status, and de-embedding method? For example, a 1GHz bandwidth oscilloscope usually can’t meet the bandwidth and measurement uncertainty requirements for most 10G high-speed signals – always check the protocol’s test specification for applicability.
- Clear distinction of test states: Does it specify whether the result is un-equalized, post-receiver equalization, or full system performance? Some brands post eye diagrams after heavy equalization, which looks great but reflects system performance, not the cable’s own performance.
- Qualified test lab: Does the testing body have ISO 17025 accreditation or relevant industry association authorization for the specific test item? Reports from accredited labs are far more trustworthy; results from labs without the right qualifications and calibration capabilities have limited reference value.
- Complete raw records: Does it retain raw waveforms, measurement parameters, sample IDs, and pass/fail conclusions? A report that’s just a screenshot of an eye diagram with no key test parameters or sample info can’t be verified, and has very limited value.
General Workflow for Professional Testing
For R&D or test engineers running formal eye diagram testing, a strict workflow is required to ensure accurate, repeatable results.
Test Equipment and Fixtures
The core equipment for eye diagram testing is a sampling oscilloscope, paired with a bit error rate tester (BERT) or pattern generator to produce standard test signals. You’ll also need protocol-specified test fixtures and calibration standards.
A common question: “How much oscilloscope bandwidth do I need for a given data rate?” There’s no universal fixed formula – it depends on the protocol’s conformance requirements, the signal’s maximum frequency, rise time, and measurement uncertainty. The most accurate approach is to check the relevant protocol’s test specification directly.
Other accessories like high-speed differential probes, coaxial channels, and optical receiver modules must match the specific test method – you can’t mix and match randomly. For some tests, you’ll also need auxiliary equipment like TDR/TDT (Time Domain Reflectometry/Transmissometry), VNA (Vector Network Analyzer), or optical power meters for combined testing.
Calibration, Fixture De-Embedding, and Verification
Calibration and de-embedding before testing are critical steps for accurate results:
- First, complete all required calibration for instruments, channels, probes, and fixtures per the spec, to ensure device error is within acceptable limits.
- Next, perform fixture de-embedding: Test fixtures and adapters have their own loss and reflections, which skew test results. De-embedding uses calibration to remove these extra effects, so you get the true performance of the sample. Common de-embedding methods include SOLT and TRL – use the one specified by the standard.
- After de-embedding, verify the calibration result with a standard reference part or known-good sample, to confirm residual error is within acceptable limits and avoid skewed results from incorrect de-embedding.
- Also record calibration date, ambient temperature, connection method, and measurement uncertainty. Calibration validity periods, re-calibration cycles, and test completion deadlines follow instrument specs, lab SOPs, and protocol requirements – you can’t calibrate once and use it forever.
Acquisition and Analysis
Once prep is done, you can start formal acquisition and analysis. The general steps are:
- Configure the data rate, test pattern, signal amplitude, bandwidth limit, and clock recovery method per the standard. For example, some protocols require a PRBS31 (pseudorandom binary sequence 31-bit) pattern, others use PRBS15 – don’t swap them arbitrarily.
- Connect the sample, confirm connectors are fully seated, terminations are correct, polarity isn’t reversed, and differential channels are functioning normally.
- Acquire enough UI and waveform samples per the standard. Don’t treat “1M UI” as a universal threshold for all tests – different protocols have different sample size requirements.
- Load the eye diagram mask for the corresponding data rate and test point – double-check you’re using the right mask.
- Measure required metrics like eye height, eye width, jitter, crossover point, amplitude, and mask margin.
- Fully record equalization status, de-embedding status, environmental conditions, and raw data for later review.
- Perform repeatability and reproducibility testing per the standard, and re-check any anomalous results – don’t draw conclusions from a single test run.
Test Priorities by Product Type
Different product types have completely different eye diagram test priorities. Here’s a quick reference table:
| Test Object | Key Focus Areas |
|---|---|
| High-speed copper cables (USB, HDMI, DP, etc.) | Protocol version, channel loss, mask compliance, differential pair balance, jitter, official certification requirements |
| Ethernet PHYs, DAC/AOC cables | Specific physical layer standard, data rate, FEC, return loss, crosstalk, BER, conformance metrics |
| Passive fiber patch cords | Insertion loss, return loss, end face cleanliness, connector quality, mechanical reliability |
| Active optical cables and transceiver links | Optical eye diagram, extinction ratio, optical modulation amplitude, jitter, receiver sensitivity, BER |
| High-speed buses (PCIe, SATA, SAS, etc.) | Generation-specific test patterns, fixtures, channel loss, eye diagrams, protocol conformance requirements |
| Automotive and industrial high-speed wiring harnesses | Specific physical layer specs, environmental stress (temperature, vibration, bending), EMC, industry/OEM requirements |
Eye Diagram Report Interpretation and Troubleshooting
When you get an eye diagram report, you don’t just check pass/fail – you can reverse-engineer potential fault causes from abnormal shapes to quickly locate issues.
Common Abnormal Eye Diagram Shapes
Here are 6 of the most common eye diagram abnormalities, their likely causes, and recommended follow-up tests:
| Abnormal Shape | Likely Causes | Recommended Follow-Up Tests |
|---|---|---|
| Vertical closure / low eye height | Excessive insertion loss, insufficient signal amplitude, high noise, severe crosstalk, termination issues | Insertion loss, crosstalk, signal amplitude, BER |
| Horizontal closure / narrow eye width | Excessive total jitter, severe ISI, channel delay mismatch, clock recovery issues, reflections | Jitter decomposition, TDR, BER |
| Offset or asymmetric crossover point | Transmitter duty cycle distortion or amplitude asymmetry, unbalanced differential pairs, channel delay difference, measurement system calibration error | Differential impedance, channel delay, single-ended waveform, transmitter signal quality |
| Thickened edges | High noise, crosstalk, insufficient system bandwidth, external electromagnetic interference | Spectrum analysis, crosstalk, grounding and shielding inspection |
| Ghosting / multiple traces | Impedance discontinuities, connector reflections, crosstalk, ISI | TDR, VNA, connector appearance and end face inspection |
| Low optical eye diagram extinction ratio | Transmitter bias anomaly, end face contamination, excessive bending loss, poor device performance | Optical power, insertion loss, end face inspection, BER |
5-Step Troubleshooting Method
When an eye diagram fails, don’t immediately blame the cable. Follow these 5 steps to avoid wasted effort:
- Check the test system first: Verify calibration hasn’t expired, probes/fixtures aren’t damaged, connectors are fully seated, and fiber end faces are clean. More often than not, the problem is on the test side, not the sample.
- Verify equipment status: Test with a standard reference part or known-good sample to confirm the equipment and fixtures are working properly, and rule out system error.
- Inspect sample connections and appearance: Check the sample’s connectors, crimps, solder joints, and terminations for issues, look for excessive bending, and check for damaged shielding. Many eye diagram abnormalities come from connector or assembly issues, not the cable itself.
- Use combined testing to find root cause: Pair eye diagram results with TDR, VNA, insertion loss, return loss, crosstalk, and BER testing to locate the exact fault point. For example, if TDR shows an impedance jump at a specific location, that’s where the connector or cable issue is.
- Re-test under real-world conditions: Re-test in the target operating environment – for example, high/low temperature, bending, vibration, or with nearby interference sources – to confirm the issue reproduces and that fixes work. Lab ideal conditions can be very different from real-world use cases.
Performance Optimization Tips
If the cable’s eye diagram performance really is below spec, optimize from these angles:
- Design side: Control impedance, differential pair skew, and channel loss appropriately. Choose the right conductor material, insulation material, and shielding structure – for example, foamed insulation reduces loss, and multi-layer shielding reduces crosstalk.
- Manufacturing side: Stabilize twisting, extrusion, crimping, soldering, and connector assembly processes, and strictly control batch consistency to avoid passing one batch and failing the next.
- Usage side: Strictly follow the product’s minimum bend radius, maximum transmission length, and termination requirements. Don’t bend cables sharply, don’t bundle them with power cables, and keep them away from strong electromagnetic interference sources.
- System side: Within protocol limits, you can evaluate equalization technologies like CTLE, FFE, and DFE to improve the eye diagram. But note: Post-equalization results reflect performance under a specific system configuration, and are not equivalent to the cable’s own performance. A low-quality cable might pass with heavy equalization, but fail when used with a device that doesn’t have that equalization capability.
Certification, Acceptance, and Compliance
A lot of people mix up “test reports” and “official certification” – they’re very different, so it’s critical to know the difference during acceptance.
The Difference Between Certification and Testing
Different types of tests have different purposes and use cases. You can’t judge trustworthiness just by the type of test lab – you have to evaluate test purpose, standard basis, lab authorization scope, calibration traceability, raw data retention, and report verifiability together:
- Official Association Certification: Like USB-IF certification, HDMI LA certification, VESA certification, etc. These are developed by the relevant industry association and tested by authorized labs. Passing allows you to use the official logo per the rules, and test items and workflows strictly follow association certification specs. These are for products that need to use official logos and join the compliant ecosystem.
- Third-Party Lab Test Report: Issued by a qualified third-party lab. If the lab has test authorization for the relevant protocol, the results can be used as a compliance reference. The impartiality of general third-party testing depends on the lab’s qualifications, calibration traceability, and test process rigor – it is not the same as official certification.
- In-House Enterprise Testing: Completed by a company’s own lab, mainly for internal R&D iteration, production quality control, and incoming material screening. Its external reference value depends on the company’s testing capabilities and data traceability.
- Engineering Screening Tests: Simplified tests done during R&D or on-site troubleshooting to quickly locate issues. Results are only for internal problem-solving reference, and cannot be used for formal acceptance or compliance judgments.
Test requirements vary completely by industry and protocol. For example, Ethernet, automotive electronics, and optical communication products must reference specific physical layer or product specs – just saying “meets industry standards” is meaningless, since there are hundreds of industry standards, and no specific version means no real information.
What Should a Valid Test Report Include?
A formal eye diagram test report should include at minimum:
- Sample model, batch, length, connector type, and test quantity;
- Protocol version, data rate, test point, test pattern, bandwidth limit, equalization status, and de-embedding status;
- Test instrument model, fixture model, calibration information, and test environmental conditions (temperature, humidity, etc.);
- Eye diagram screenshots, mask compliance results, and all required metrics like eye height, eye width, jitter, and BER;
- Raw data notes, pass/fail basis, measurement uncertainty, and corrective action recommendations for failed samples.
If a report is missing most of these items, its reference value is highly questionable.
Acceptance Decision Tips
Whether you’re a personal shopper or a corporate procurement team, don’t use a single eye diagram to replace full validation:
- For regular consumers: Prioritize products with official certification, clear protocol labeling, appropriate length for your use case, and good user compatibility reviews. Third-party test reports can be a secondary reference, but don’t treat them as the only judging criteria.
- For engineering and R&D acceptance: Define acceptance criteria upfront – which protocol spec version to use, what sampling rate to apply, what repeatability requirements exist, and whether environmental stress tests like high/low temperature, vibration, or bending are required. Only with all conditions clearly defined do acceptance results have meaning.
Common Myths and FAQ
We’ve compiled the most frequently asked questions about eye diagrams to help you avoid common pitfalls.
Beginner Questions
Q: Can eye diagram testing replace insertion loss and BER testing?
A: No. All three tests focus on different things: insertion loss measures signal attenuation, eye diagrams show overall signal shape and margin, and BER measures a link’s final bit error performance. You usually need to combine multiple tests for a full assessment, and the exact test mix depends on protocol requirements, product type, and test goals. None can replace the others.
Q: Do regular users need to buy eye diagram test equipment?
A: Almost always no. A sampling oscilloscope capable of high-speed signal testing costs tens to hundreds of thousands of dollars. Regular consumers are better off verifying official certification and legitimate third-party reports, rather than buying professional test equipment.
Q: Do low-speed cables never need eye diagram testing?
A: Not necessarily – it depends on the test purpose and specific standard. For example, some industrial low-speed links have strict signal quality requirements, and may use eye diagram testing. But for everyday troubleshooting, testing continuity, impedance, insertion loss, and real-device compatibility is more practical than running an eye diagram test.
Q: If an eye diagram passes, does that mean the cable is durable?
A: No. Eye diagrams only reflect electrical or optical signal performance. Mechanical durability, temperature/humidity resistance, insulation safety, and long-term lifespan all require dedicated reliability testing, and have no direct relationship to eye diagram results.
Professional Questions
Q: How do I determine the required oscilloscope bandwidth?
A: It’s determined by a combination of protocol spec requirements, test point location, signal rise time, filtering requirements, and measurement uncertainty. Don’t rely on rigid rules like “bandwidth must be 3x/5x the data rate” – the most accurate method is to check the relevant protocol’s conformance test specification directly.
Q: Why is de-embedding necessary?
A: Test fixtures, adapters, and probes introduce their own loss and reflections, which are not part of the sample’s inherent performance. De-embedding uses calibration to remove these extra effects, so you get the true characteristics of the sample. But de-embedding requires using the correct model, and you must verify residual error – incorrect de-embedding will produce even more inaccurate results.
Q: Can post-equalization eye diagrams be used as proof of cable performance?
A: No. Equalization is a signal processing function on the transmitter or receiver side. A post-equalization eye diagram only shows that the link signal works under that specific system configuration – it does not represent the cable’s own performance. For example, a low-quality cable might produce an open eye with heavy equalization, but fail to work when paired with a device that lacks that equalization capability.
Q: Why do different test setups produce different eye diagram results?
A: Eye diagram results are affected by many factors: standard version, test fixture, calibration status, instrument bandwidth, test pattern, clock recovery method, equalization settings… If even one condition differs, results can vary dramatically. To compare eye diagrams of different samples, you must standardize all test conditions.
Q: How do you tell PAM3, PAM4, and NRZ eye diagrams apart?
A: First, confirm the protocol version and signal encoding method, then count the number of levels in the eye diagram: NRZ has 2 levels and 1 eye opening, PAM3 has 3 levels and 2 eye openings, PAM4 has 4 levels and 3 eye openings. Always interpret results per the relevant standard – you can’t apply NRZ metrics to a PAM4 eye diagram.
Summary and Quick Reference Checklist
Key Takeaways
To wrap up, here are the most critical conclusions to build a correct understanding of eye diagrams:
- Eye diagrams are an important tool for high-speed link signal integrity analysis, but they are not a single quality judgment standard for all cables. Don’t overstate what an eye diagram can tell you.
- Before reading an eye diagram report, confirm the protocol version, test object, test conditions, mask basis, equalization status, and calibration information. Only when these prerequisites are correct does the result have reference value.
- Abnormal eye diagrams only point you in the direction of a problem. To find the root cause, you need to combine tests like insertion loss, return loss, crosstalk, impedance, TDR/VNA, and BER for joint localization.
- Different product types have different test priorities: passive fiber patch cords, active optical cables, network physical layer products, and high-speed copper cables all have completely different evaluation criteria – don’t mix them up.
Quick Reference Checklist
Keep this handy for fast reference:
- Reading reports: First check standard version, data rate, length, test point, mask, equalization status, de-embedding status, and calibration info. If any are missing, be skeptical.
- Reading eye diagrams: Vertical opening tells you about amplitude and noise; horizontal opening tells you about timing and jitter. If you see ghosting, first check for reflections and ISI.
- Validating performance: Eye diagrams can’t replace insertion loss, return loss, crosstalk, BER, or environmental reliability testing – always evaluate product performance comprehensively.
- Troubleshooting: First check the test system itself, then check terminations and connectors, and finally locate issues with the cable itself or the operating environment.
Once you understand the principles and limits of eye diagrams, you’ll avoid common pitfalls when shopping for cables, running acceptance tests, or troubleshooting links – and you won’t be swayed by a vague eye diagram screenshot from a marketing page.