
1. Introduction
Have you ever had these experiences? You use the same phone but swap chargers: one juices it up to 60% in 30 minutes, while another gets scorching hot but barely adds any battery. You buy a 20,000mAh power bank, but it only charges your phone twice before dying. You leave your phone on a wireless charger overnight, only to wake up to an undercharged, overheated device. Beyond common false power rating claims, most of these issues boil down to charging efficiency.
Charging efficiency is more than just an abstract energy number—it directly reflects energy loss across the charging chain, heat-related risks, and even long-term device lifespan. From wireless earbuds and smartwatches to portable power stations and EV chargers, any device that charges benefits from efficiency testing. Whether you’re a casual user troubleshooting charging issues and avoiding overhyped, underperforming accessories, or an industry professional working on product quality control, understanding how to test charging efficiency will save you time and frustration.
2. Key Metrics to Measure for Charging Efficiency
Testing charging efficiency isn’t just about calculating a single percentage. You need to evaluate multiple metrics together to get a full picture of performance and reliability.
2.1 Basic Energy Efficiency Metrics: The Most Commonly Used Evaluation Tools
These are the most widely used metrics for at-home testing and basic assessments, and they directly impact real-world user experience:
- Full-cycle average efficiency: The overall energy efficiency from a set starting state of charge (SOC) to a target SOC (e.g., 0% to 100%). This shows total loss across the entire charging process, but since the late-stage trickle charge phase has lower efficiency, it may not reflect real-world daily use.
- 20%-80% SOC range efficiency: This matches the most common daily charging window for most users. By excluding the special charging strategies used at very low and full battery levels, it’s better for side-by-side comparisons of real-world efficiency across products.
- Peak power and duration: Many products advertise high-wattage fast charging, but in practice, they may only sustain peak power for a few minutes before throttling due to heat. This metric verifies the accuracy of fast-charging claims and measures power retention, which is directly tied to both efficiency and temperature rise.
- Phase-by-phase charging proportion: Charging typically has three phases: constant-current fast charge, constant-voltage charge, and trickle charge. Each phase has different efficiency, and their relative durations affect overall efficiency and user experience. For example, a phone that switches to trickle charge at 80% will have lower overall efficiency than one that switches at 90%.
- Standby/no-load power consumption: The power used by chargers or charging pads when plugged in but not actively charging a device. For devices that stay plugged in long-term (like router power adapters or wireless charging docks), high standby consumption can waste a lot of electricity over a year, making it an important part of efficiency evaluation.
2.2 Reliability-Related Metrics: Beyond the Efficiency Number
A good efficiency number doesn’t guarantee a reliable product. You also need to consider these reliability-focused metrics:
- Temperature rise and hot spot location: Almost all lost energy converts to heat, so lower efficiency usually means more heat generation. Temperature directly impacts component safety margins and lifespan: for semiconductors and capacitors, every 10°C (18°F) increase in operating temperature can cut lifespan in half. When testing, measure not just the maximum temperature, but also where the hot spots are—for example, an overly hot charging port may indicate excessive contact resistance.
- Efficiency change after cycle aging: High efficiency out of the box doesn’t mean much—what matters is stable performance after hundreds of charge-discharge cycles. Comparing efficiency, temperature rise, charging time, and capacity retention before and after aging gives a clear picture of long-term product reliability.
- Efficiency retention in extreme environments: Daily use temperatures vary widely—40°C (104°F) inside a car in summer, or -10°C (14°F) or colder outdoors in winter. How well efficiency holds up (and whether the device even charges at all) in these conditions reflects environmental reliability.
- Protocol handshake success rate and power stability: Fast charging requires the charger and device to “handshake” and match a compatible charging protocol. Frequent handshake failures or fluctuating power not only slow charging, but also reduce overall efficiency and can even cause charging to stop entirely.
2.3 Auxiliary Professional Metrics: For Advanced Testing
For professional testing of power supplies and charging products, you’ll need to track additional electrical metrics: active power, power factor, harmonics, ripple noise, load regulation, and efficiency-load curves, to name a few. For products like power adapters, portable power stations, and EV chargers, efficiency alone isn’t enough—you’ll need to combine results with safety compliance, EMC (electromagnetic compatibility), and thermal design assessments.
3. Practical Unit Conversion: Don’t Fall for mAh Marketing Hype
Many products advertise capacity in mAh, but mAh is a measure of current capacity. To find actual usable energy (measured in watt-hours, or Wh)—the real metric that determines how much charge you get—you have to factor in voltage.
The core calculation formula:
Wh = Nominal Voltage (V) × Capacity (Ah), and 1Ah = 1000mAh
Take a common example: a power bank advertised as 20,000mAh uses the 3.7V of its internal battery cells to calculate that capacity. Total energy is 3.7V × 20Ah = 74Wh. When outputting at 5V (the standard for most phone charging), even with 100% conversion efficiency, the output capacity only comes out to 74Wh ÷ 5V = 14.8Ah = 14,800mAh—nowhere near the advertised 20,000mAh. So when shopping for a power bank, don’t just look at the mAh number. Check the Wh rating, and factor in conversion efficiency to get a real idea of how many charges you’ll get.
4. Why Does Charging Efficiency Drop? Full-Chain Factors and Troubleshooting Steps
Low charging efficiency is rarely caused by a single component—it’s usually the result of issues across the entire charging chain. When troubleshooting, work from the simplest, cheapest fixes first to narrow down the cause.
4.1 Four Key Stages That Impact Efficiency
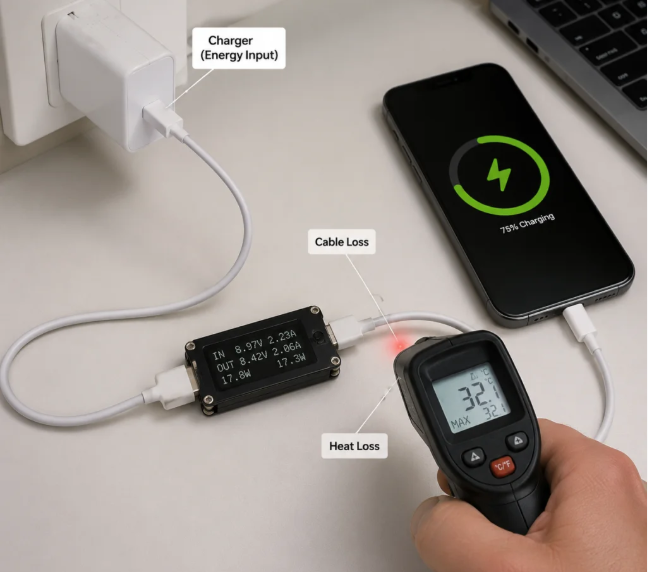
The full charging chain has four main stages, each of which can affect efficiency:
- Charging source: This includes power adapters, EV chargers, and other power supply devices. Output efficiency is affected by the charger’s circuit topology, component efficiency, protocol compatibility with the device being charged, current load level, and (for multi-port chargers) power allocation logic. For example, using a non-PD charger for an iPhone will force it to charge at 5V slow speeds, with worse efficiency and slower charging.
- Transmission stage: This covers cables and ports; for wireless charging, it also includes coils and the material between them. Higher cable resistance means more energy loss, which is why high-wattage fast charging requires thicker cables with E-marker chips to handle large currents and reduce line loss. Dirty, oxidized, or loose ports increase contact resistance, causing heat and lower efficiency. For wireless charging, misaligned coils, too much distance between the charger and device, or metal objects in between will drastically increase loss and reduce efficiency.
- Receiving end: This is the device being charged. Actual efficiency is affected by the battery management system (BMS) charging strategy, battery health, temperature control logic (which throttles power when too hot), power draw from using the device while charging, and background system power consumption. For example, a phone with 80% battery health will have lower efficiency and slower charging than a brand-new device.
- Environment: Temperature is the biggest environmental factor. High temperatures accelerate component aging and trigger overheat protection, which reduces charging power and hurts efficiency. Cold temperatures lower the chemical activity of lithium-ion batteries, reducing the maximum charging current they can accept, slowing charging, and lowering efficiency.
4.2 Troubleshooting Order for Abnormal Efficiency: Easiest to Hardest
If you notice low efficiency, slow charging, or excessive heat, follow this order, starting with the simplest, lowest-cost fixes:
- Swap in a certified, compatible cable: Cables are the most common point of failure, and the easiest to replace. Try a known-good, properly rated cable to see if efficiency improves. This rules out excessive line resistance, worn connectors, or a faulty E-marker chip.
- Try a protocol-matched charger: Check that the charger and device support the same charging protocol, and that the device is entering the expected fast-charging mode. For example, using a QC-only charger with a PD phone will likely limit you to 5V slow charging, resulting in low efficiency.
- Check the device itself: Verify that battery health isn’t too low, that no power-hungry apps are running in the background, and that the temperature control logic isn’t being overly conservative and throttling power due to heat. Try restarting the device and closing background apps to see if that helps.
- Double-check environment and test conditions: Make sure the ambient temperature isn’t too high or too low, that wireless chargers are properly aligned, that phone cases aren’t too thick, and that your testing tools aren’t inaccurate. All of these can cause abnormal results.
5. Standards and Typical Efficiency Reference Ranges
A lot of people ask, “What’s a normal charging efficiency?” There’s no one-size-fits-all answer, since it varies widely by product type and test conditions—but you can use common industry ranges and relevant standards as a reference.
5.1 What Are the Common Relevant Standards?
Charging efficiency-related standards fall into three main categories:
- Energy efficiency and regulatory standards: Examples include the EU’s ErP (Energy-Related Products) Directive, the U.S. Department of Energy (DOE) efficiency requirements, and national energy labeling systems around the world. These standards set mandatory or voluntary efficiency rules for different products, with exact applicability depending on product category.
- Product and interface specifications: These include the USB-IF PD charging standard, the WPC Qi wireless charging standard, and IEC international standards for EV chargers. These standards mainly define protocols, interoperability, safety, and performance requirements, and often include efficiency-related clauses.
- Reliability testing standards: Tests for high/low temperature, humidity, thermal shock, vibration, drop resistance, plug-in lifespan, and cycle aging all have corresponding international, national, or enterprise-level standards to evaluate product reliability under various conditions.
5.2 Efficiency Reference Ranges by Product Category
The table below shows typical efficiency ranges for different product categories and use cases. These are industry rule-of-thumb values, not mandatory pass/fail thresholds. For official judgments, always refer to applicable standards, manufacturer specifications, and professional lab test results:
| Category / Use Case | Typical Reference Range | Notes |
|---|---|---|
| Standard wired charging | ~80%–90% | Depends on charger, cable, device PMIC, and SOC range |
| High-wattage fast charging | ~85%–95% | Temperature rise and power throttling logic have a significant impact at high power levels |
| Qi wireless charging | ~60%–80% | Heavily affected by alignment, distance, phone case thickness, and heat dissipation |
| Power bank output conversion | ~80%–90% | Distinguish between cell-to-port efficiency and full charge-discharge round-trip efficiency |
| Portable power station AC output | ~80%–90% | Strongly tied to inverter efficiency and load level |
| AC EV charging chain | ~85%–95% | Distinguish between charger-side, on-board charger, and battery-side efficiency |
| DC fast EV charging chain | ~90%–96% | Depends on specific device specs and test boundaries |
5.3 What Are Standard Test Conditions?
For test results to be comparable, they must be collected under consistent standard conditions:
- Standard baseline conditions: Typically ~25°C (77°F) ambient temperature, stable input power, consistent sample state (e.g., brand-new, uniform starting SOC), fixed test SOC range, and no extra load. Only results collected under these conditions can be fairly compared across products.
- Professional lab procedures: Formal testing also requires sample preconditioning, instrument calibration, testing at multiple load points, repeated cycle verification, data acquisition, and measurement uncertainty evaluation. For legally valid reports, testing must be conducted by an accredited lab (e.g., ISO 17025 certified, or regional equivalents like A2LA in the U.S. or CNAS in China).
6. How Charging Efficiency Relates to Reliability
Many people think charging efficiency only matters for “saving electricity,” but it’s closely tied to product reliability and safety. Efficiency is a surface-level indicator—reliability is the core concern.
6.1 The Link Between Efficiency, Temperature Rise, and Reliability
During charging, power loss equals input power minus output power, and almost all of that lost energy turns into heat. Lower efficiency means more loss, which means more heat.
Temperature rise is a critical factor for reliability: excessive heat accelerates component aging and shortens product lifespan. It also triggers overheat protection, which throttles power and further hurts charging speed and efficiency stability. In severe cases, overheating can even cause safety hazards. That’s why reliability assessments shouldn’t rely on efficiency numbers alone—you need to simultaneously track efficiency, temperature rise, power curves, and abnormal protection actions to get a full picture.
6.2 How to Evaluate Long-Term Reliability
To evaluate long-term reliability, don’t just look at a new product’s efficiency—look at how it changes after cycle aging:
- Run charge-discharge cycle tests to compare changes in efficiency, capacity retention, battery internal resistance, temperature rise, and charging time before and after aging.
- A drop in efficiency can be a sign of aging, but it can’t be used alone to judge battery health. It must be analyzed alongside capacity tests and internal resistance measurements.
- We recommend fixing the test SOC range and environmental conditions, and building a long-term historical data trend. This lets you accurately judge a product’s aging rate and remaining lifespan.
6.3 Efficiency and Reliability in Extreme Environments
Real-world use happens in all kinds of conditions, and performance in extreme environments is a true test of reliability:
- High-temperature environments: Focus on whether power throttling triggers, whether maximum temperature rise stays within safe limits, whether protection functions activate correctly, and whether the device works normally once temperatures return to normal. High heat doesn’t just reduce efficiency—it accelerates aging, making it a major factor in product lifespan.
- Low-temperature environments: Focus on the battery’s charging acceptance, changes in charging time, and the BMS’s low-temperature limiting strategy. In very cold conditions, lithium-ion batteries may stop charging entirely, or see a sharp drop in efficiency. This is a normal protection mechanism, but low-temperature performance varies widely between products.
- Humidity, salt spray, and thermal shock: These conditions corrode connectors, degrade insulation, and increase contact resistance, leading to lower efficiency, poor connections, and even safety risks. These are critical tests for outdoor and automotive-grade products.
6.4 Mechanical and Safety Reliability Links
Beyond electrical performance and environment, mechanical factors also impact charging efficiency and reliability:
- Plug-in lifespan: Repeated plugging and unplugging wears down charging ports, increasing contact resistance, heat, and efficiency loss. For example, if a phone you’ve had for a few years gets hot around the charging port, it’s likely due to worn, oxidized connectors.
- Vibration/drops: Vibration and drops can loosen internal wiring and cause poor connections, leading to power fluctuations, charging interruptions, or even faulty protection mechanisms.
- Abnormal condition protection: How quickly and reliably protection circuits respond to faults like overvoltage, undervoltage, overcurrent, short circuits, and overheating is the core of safety reliability—far more important than raw efficiency numbers.
7. How to Interpret and Apply Test Results
Once you’ve tested efficiency, how do you tell if the results are normal? And how do you use those results to fix real-world problems?
7.1 Basic Logic for Interpreting Results
Follow these steps to judge test results—don’t just compare numbers to reference ranges out of context:
- Confirm test boundaries and conditions first: Clarify which part of the charging chain you’re testing, what SOC range you’re using, the ambient temperature, and what accessories you’re using. An efficiency number without clear boundaries is meaningless.
- Compare against standards or specifications: Based on the product category, check against relevant efficiency standards, manufacturer specs, or industry reference ranges to see if efficiency falls within a reasonable window.
- Troubleshoot abnormalities step by step: If efficiency is clearly too low, follow the order we covered earlier—cable → charger → device → environment → test tools—to find the root cause.
- For reliability, look at rate of change, not single values: If you’re running aging or environmental reliability tests, don’t fixate on a single efficiency number. Focus on how much efficiency changes after aging or across different environments—the smaller the change, the better the reliability.
7.2 Practical Tips to Improve Charging Efficiency and Reliability
Whether you’re a casual user or an industry professional, these tips will help improve charging efficiency and reliability:
- For casual users:
- Choose certified, protocol-matched charging accessories with appropriate power headroom. Don’t chase the highest wattage for its own sake, and never use cheap, uncertified products.
- Charge at room temperature whenever possible. Avoid long charging sessions in hot cars parked in direct sun or in very cold outdoor conditions.
- Don’t play high-demand games while charging, as this causes excessive heat buildup.
- Clean charging ports regularly to prevent dust and oil from increasing contact resistance. If a port feels loose, get it repaired promptly instead of forcing it to work.
- For product testing and R&D teams:
- Build a long-term database of efficiency, temperature rise, power curves, and failure modes. Track performance across different designs and components to inform future product improvements.
8. Common Myths and Frequently Asked Questions
There are a lot of misconceptions about charging efficiency. Below, we break down the most common myths and answer the most frequently asked questions.
8.1 Common Myths You Might Believe
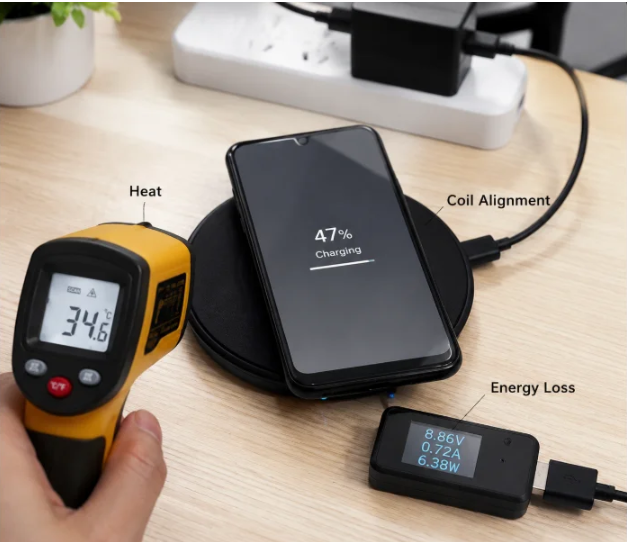
- Myth 1: Higher charging power means higher efficiency
Fact: Power is a measure of speed, while efficiency is a measure of loss ratio—there’s no direct link between them. At higher power levels, current is larger, which increases line loss and heat generation. Sometimes efficiency is actually lower at higher power levels. The benefit of high power is faster charging, not better efficiency.- Myth 2: Low wireless charging efficiency means the product is bad
Fact: Wireless charging transfers energy via magnetic coupling, which has inherent coupling losses—so it’s naturally less efficient than wired charging. Alignment accuracy, coil distance, phone case thickness, and heat dissipation all have a huge impact on efficiency. Even a high-quality wireless charger will have low efficiency if the phone isn’t properly aligned.- Myth 3: Charging efficiency can reach 100%
Fact: Every energy conversion and transmission process has losses. The charger’s AC-to-DC conversion, cable transmission, and the battery’s chemical charging process all lose energy at every step. Charging efficiency can never reach 100%.- Myth 4: You can accurately calculate efficiency just by looking at the battery percentage
Fact: The battery percentage shown by your device is an estimate based on voltage and current, and it has margins of error. Different brands and operating systems use different estimation logic. To calculate efficiency accurately, you need to use cumulative energy data from a power meter, not just the on-screen battery display.
8.2 7 Most Frequently Asked Questions
- How do you measure charging efficiency accurately?
For casual at-home testing, control as many variables as possible: test at ~25°C (77°F) room temperature, use the same starting battery level every time, close background apps, keep the screen off, and use a reputable USB power meter or smart plug. Test 2-3 times under the same conditions and average the results, and always note your test boundaries. For precise professional results, work with an accredited lab that uses calibrated instruments and follows standard testing procedures. - What’s a normal fast-charging efficiency for phones?
Generally, for full-chain (wall outlet to phone battery) wired high-wattage fast charging in the 20%-80% SOC range at room temperature, 85%-95% is normal. The exact number depends on power level, the phone’s thermal design, and the quality of the charger and cable. If efficiency is below 80%, it’s worth troubleshooting for incompatible accessories or device issues. - Why does charging slow down after 80%?
This is a protection mechanism for lithium-ion batteries. When a lithium-ion battery is nearly full, it can’t handle large charging currents anymore—doing so would damage the battery and increase safety risks. So the BMS gradually reduces the charging current, entering the constant-voltage and then trickle-charge phases. This phase is not only slower, but also less efficient than the fast-charging phase. It’s completely normal. - Why does charging efficiency drop in cold weather?
Lithium-ion battery charging is an electrochemical reaction. In low temperatures, the electrolyte becomes more viscous, and lithium ion activity decreases. This reduces the maximum charging current the battery can accept, slowing charging. At the same time, electrochemical losses during charging increase in cold weather, further lowering efficiency. In very cold temperatures, the BMS may even stop charging entirely to avoid damaging the battery. - Is it normal for wireless charging to get hot?
Wireless charging naturally generates more heat than wired charging due to coupling losses. Under normal conditions, it’s fine as long as temperatures stay within safe limits (for example, no more than 45°C / 113°F on the back of the phone, or 60°C / 140°F on the charger housing—exact limits depend on product standards). If it gets hot enough to be painful to touch, check for misaligned coils, metal objects between the charger and device, an overly thick phone case, or a defective product. - Does dropping charging efficiency always mean the battery is aging?
Not necessarily. There are many causes of lower efficiency: worn cables, oxidized ports with poor contact, faulty chargers, changes in ambient temperature, or even a system update that adjusts charging strategy. Battery aging is just one possible cause. To judge if a battery is aging, you need to look at multiple factors together: capacity retention, internal resistance tests, and changes in charging time. - Why is my at-home test data so different from lab reports?
The most common reasons are:- Different test boundaries: For example, a lab might test the charger’s own conversion efficiency, while you’re testing full-chain efficiency.
- Different test conditions: Labs use controlled constant-temperature, constant-voltage environments, while your home test might have fluctuating temperatures or unstable power.
- Different instrument accuracy: A basic USB power meter might have 5% or more error, while lab-grade instruments have 0.1% level accuracy.
- Different sample state: Labs use brand-new samples, while your device might have been used for years with degraded battery health.
9. Conclusion
All in all, charging efficiency isn’t an isolated number—it’s a comprehensive reflection of performance across every stage of the charging chain, and a key reference for judging product reliability and safety. Whether you’re a casual user picking accessories and troubleshooting small charging issues, or an industry professional working on product R&D and quality control, understanding proper charging efficiency testing methods will help you see a device’s real performance clearly, and avoid the pitfalls of overhyped, low-quality products. Next time you run into slow charging or overheating, try troubleshooting from an efficiency perspective—you might find the cause faster than you think.