
Have you ever had this experience: you buy a portable SSD with “USB 3.2” and “up to 1000MB/s” printed on the package, but when you plug it into your computer to transfer files, it’s as slow as a snail; you spend a lot of money on a 240W USB-C fast charging cable, but transferring data with a USB drive is even slower than an old USB-A cable; your computer has seven or eight USB ports, and you don’t know which one to plug into to get full speed.
At this time, you don’t need to rush to replace your devices. First, test with a USB speed comparison tool—it can help you see the real transmission speed of your current “port + cable + device” combination and find the bottleneck that slows down the speed. Many people think it’s just a speed testing software, but in fact its scope is wider than imagined: dedicated speed testing software, system information tools, timing file copy times yourself, and even online speed conversion calculators all fall into the category of USB speed comparison tools.
1. First, Understand: What It Can and Cannot Do
Simply put, the core function of a USB speed comparison tool is to measure the actual data transmission speed of your current USB setup, rather than just looking at the nominal parameters on the package. Overseas users should pay special attention: “up to” on English packaging refers to the ideal peak value, which usually requires specific computers, cables, testing tools, file sizes, and temperature conditions to achieve, and it is difficult to reach full speed in daily use.
What it measures is not the “permanent upper limit” of a single hardware component, but the result of the combined effect of the computer port, cable, device controller, storage medium, and system environment. For example, the same USB drive may be several times faster when plugged into the rear port of a desktop computer than when plugged into a laptop docking station.
Of course, it also has its limits: it mainly evaluates data transmission speed, cannot directly measure PD charging power, video output bandwidth, cable durability, or port lifespan, and cannot replace a professional USB protocol analyzer—those are for engineers to do hardware debugging, and ordinary users have no use for them at all.
For ordinary users, the problems it can solve are very practical: after buying a new USB drive, portable hard drive, or portable SSD, verify whether the speed is close to the official nominal value, to avoid paying for high-speed performance but getting a low-speed experience; when the computer has multiple USB-A/USB-C ports, find the actually fastest one (for example, the ports on the rear of the motherboard, front of the case, or left and right sides of a laptop may have different speeds); when file transfer is particularly slow, troubleshoot whether the bottleneck is the device, port, cable, docking station, or file type, temperature, background tasks; compare the real differences between different types of storage, different cables, and different docking stations; it can even estimate the transfer time of large files (such as video footage, game libraries, photo backups, system images), so you don’t have to stare at the progress bar guessing how long you’ll have to wait.
People who are new to this are most likely to have four misunderstandings, let’s clarify them in advance:
First, just because the package says USB 3.2 or USB4 doesn’t mean it’s necessarily fast; the actual speed depends on the slowest link in the entire chain.
Second, a high speed test score doesn’t mean daily file transfers will always be fast; actual speed is also affected by file size, random/sequential read/write, cache, temperature, and background load.
Third, a USB-C port is not necessarily faster than USB-A; USB-C is just the port shape, and it may only support USB 2.0, or it may support USB 3.2, USB4, or even Thunderbolt.
Fourth, a fast charging cable doesn’t necessarily transfer data quickly; charging power and data rate are two completely independent parameters, and a 100W/240W cable may only have a USB 2.0 data rate.
2. Essential Knowledge Before Testing to Avoid Useless Results
Before you start testing speed, first understand a few basic concepts, otherwise the test results may have no reference value at all.
Port Shape Does Not Equal Transmission Speed
Many people judge speed by port shape, which is the most common misconception. Let’s go through them one by one:
- USB-A: The most common rectangular port, which may be USB 2.0 or USB 3.x. Many manufacturers use blue plastic inserts to identify high-speed USB, but this is not a mandatory standard—some high-end motherboards use black, red, or even other colors for high-speed USB-A, and some unscrupulous manufacturers make USB 2.0 ports blue to mislead people.
- USB-C: The oval reversible port has many possibilities: from only supporting USB 2.0 data, to 5Gbps, 10Gbps, 20Gbps, 40Gbps, or even higher, you can’t judge just by the shape.
- Micro-USB: Common on older Android phones and power banks, the vast majority are USB 2.0; a few Micro-B 3.0 ports (slightly wider than ordinary Micro-USB) are used on early portable hard drives and can support USB 3.x speeds.
- Lightning: Apple’s older port, in most scenarios its speed is close to USB 2.0; only a few older iPad Pro models supported higher camera import speeds, so ordinary users should not infer its speed based on USB-C logic.
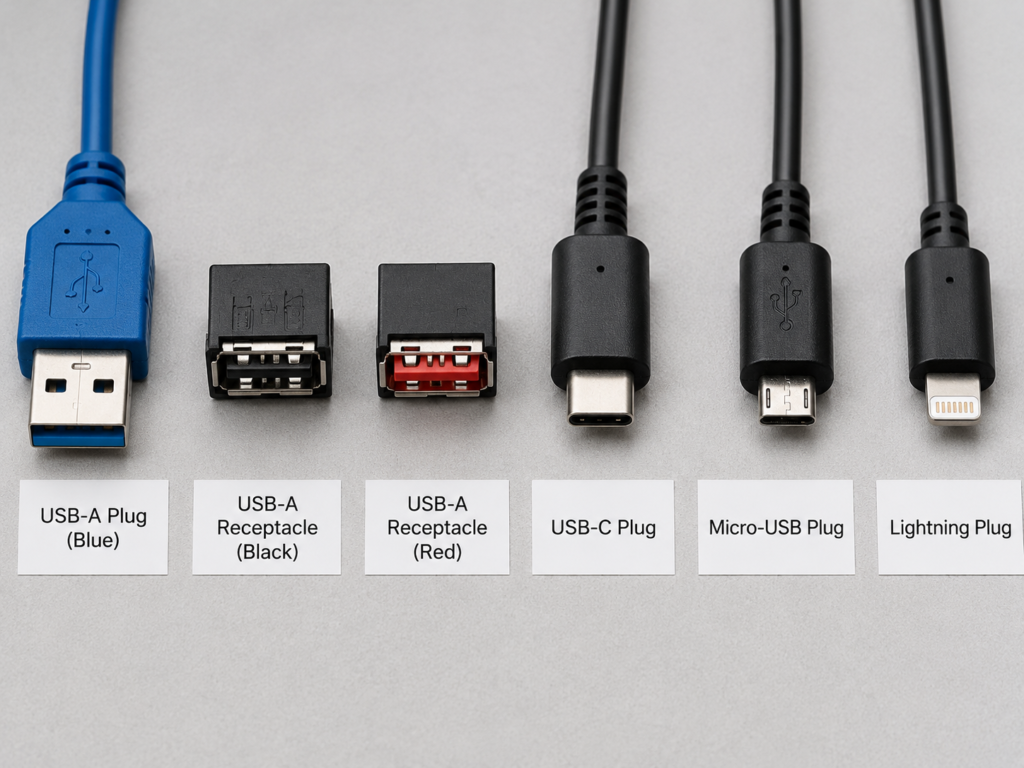
So how do you judge the real port speed? The most reliable method is not to look at color or shape, but to check the official specifications of the computer/device, the motherboard manual, or use system tools to check the negotiated rate.
Here we need to explain a key concept: negotiated rate. You can think of it as the “common speaking speed” agreed upon when the device and computer handshake: the device says it can run up to 10Gbps, the computer says this port can only run up to 5Gbps, so finally both sides communicate at 5Gbps, and this final agreed speed is the negotiated rate. For example, if a 10Gbps portable SSD uses a cable that only supports USB 2.0, the negotiated result may only be 480Mbps, which is definitely not fast.
The Pitfalls of USB Version Naming, Don’t Get Confused
USB naming has been changed many times by the USB-IF association, and many people get confused. In fact, as long as you remember “look at the number after Gen and the Gbps value, don’t just look at the major version number”, you won’t go wrong. Here we’ve organized it into a comparison table for easy reference:
| USB Version (Former Names) | Nominal Rate | Common Scenarios |
|---|---|---|
| USB 2.0 | 480Mbps | Ordinary USB drives, keyboards/mice, printers, most cheap USB-C cables |
| USB 3.2 Gen 1 (USB 3.0 / USB 3.1 Gen 1) | 5Gbps | The most common consumer-grade high-speed USB, mid-to-high-end USB drives, SATA portable SSDs |
| USB 3.2 Gen 2 (USB 3.1 Gen 2) | 10Gbps | Mid-to-high-end NVMe portable SSDs, high-speed docking stations |
| USB 3.2 Gen 2×2 | 20Gbps | Average compatibility, many USB4/Thunderbolt ports do not support this mode |
| USB4 | 20Gbps/40Gbps | Not all USB4 is 40Gbps, it depends on the device specifications |
| USB4 v2 | Up to 80Gbps | Very low penetration in consumer products, subject to official specifications and negotiated rate |
There are four core factors that determine the upper limit of USB speed: port shape, protocol version, cable capability, and device controller. You can’t reach full speed without all of them.
What is the Relationship Between USB4 and Thunderbolt 3/4
Many people confuse USB4 with Thunderbolt, but in fact they are related but not the same thing:
Thunderbolt 3 is a technology launched by Intel in its early years, earlier than USB4. Later, Intel donated the technical foundation of Thunderbolt 3 to the USB-IF association, and the USB4 specification was developed on this basis.
Thunderbolt 4 can be understood as “USB4 with stricter requirements”: it usually requires 40Gbps bandwidth, minimum PCIe bandwidth, video output, wake-up and security capabilities, and has higher certification standards.
But note: a Thunderbolt 3 port is not the same as a USB4 port; Thunderbolt 4 ports are usually compatible with USB4, but the specific peripheral compatibility depends on the host, cable, system, and device implementation. Conversely, a USB4 port does not necessarily support all the capabilities of Thunderbolt-certified devices, and the PCIe bandwidth may also be different.
Pay special attention when testing portable SSDs: even with a 40Gbps USB4/Thunderbolt port, the actual speed will be affected by PCIe lanes, bridge chips, the NVMe drive itself, heat dissipation, and the cable. Don’t think that just because it’s labeled 40Gbps, it will definitely run at full speed.
How to Convert Between Gbps and MB/s? Stop Getting the Units Wrong
This is the most common pitfall: many people think 10Gbps is 10000MB/s, but in reality it’s a world of difference.
First, distinguish the units: Gbps is a common nominal unit for ports and cables, meaning “gigabits per second”; MB/s is a common unit for file copying and speed testing tools, meaning “megabytes per second”. 1 byte equals 8 bits, so the theoretical conversion formula is: Gbps × 125 ≈ theoretical MB/s. For example, 5Gbps is theoretically 625MB/s, 10Gbps is 1250MB/s, and 40Gbps is 5000MB/s.
But this is only the theoretical value. Actual transmission also has encoding loss—that is, some “overhead bits” for verification need to be added during data transmission, so the bandwidth actually used to transfer files will be a little less:
- USB 3.2 Gen1 uses 8b/10b encoding. Simply put, 2 out of every 10 bits are for verification, and the effective bandwidth is about 80%, so 5Gbps actually has about 500MB/s available after encoding.
- USB 3.2 Gen2/Gen2x2 uses 128b/132b encoding, with a loss of only about 3%, so 10Gbps is about 1212MB/s after encoding.
- USB4/Thunderbolt is more complex. You can’t estimate just by encoding efficiency; you also have to consider USB tunneling, PCIe tunneling, controllers, bridge chips, and system overhead. The actual file speed will be much lower than the theoretical value.
- For the most common USB 2.0, the theoretical 480Mbps is 60MB/s, but actual file transfer is usually only 30-40MB/s or even lower, because the overhead is larger.
So when you see a manufacturer label 10Gbps in the future, don’t think it can reach 10000MB/s; it’s pretty good if actual file transfer reaches around 1000MB/s.
What Do the Core Speed Test Metrics Correspond To
Speed test tools will give you a bunch of numbers, you don’t need to remember all of them, just focus on these:
- Sequential Read: The speed of continuously reading large files, corresponding to the speed when you copy videos, images, and compressed packages from a USB device to your computer.
- Sequential Write: The speed of continuously writing large files, corresponding to the speed when you copy backups, video footage, and game files to a USB device.
- Random Read/Write: The ability to process a large number of small files, usually tested with 4K block size; if you often transfer office documents, photo folders, or code projects, this metric affects your experience more than sequential read/write.
- IOPS: Input/output operations per second. If you use an external drive as a system drive, game drive, or for portable software, the higher this metric, the faster the response.
- Cache and Out-of-Cache Speed: Many USB drives and portable SSDs have a “temporary high-speed area” (SLC cache). Writing small files for a short time will be very fast, but after the cache is full, the speed will drop to the real flash memory speed (that is, out-of-cache speed), and some will further slow down due to rising temperature.
The Barrel Effect of Speed: The Slowest Link Determines Overall Speed
USB transmission is like a water pipe: the flow rate of the entire pipe depends on the thinnest section. The entire chain starts from the computer’s USB controller, goes through the port, cable, HUB/docking station, device bridge chip/controller, storage medium, and finally to the file system/system driver. If any link is slow, the entire chain will be limited.
Here are a few of the most common examples: a 10Gbps portable SSD plugged into a USB 2.0 port will have a speed close to USB 2.0 level; a high-speed USB-C portable SSD using a charging cable that only supports USB 2.0 may only have 20-30MB/s; multiple portable hard drives connected to the same 5Gbps HUB and transferring at the same time will share the upstream bandwidth from the HUB to the computer, and the total speed combined will not exceed the 5Gbps upper limit.
3. How to Choose a Tool? Comparison of Mainstream Free Tools
There are many types of USB speed comparison tools, you don’t need to install all of them. Just choose 1-2 according to your platform and needs. Let’s first classify them by function:
- Basic speed test tools: mainly test continuous read/write, suitable for beginners to quickly judge whether the speed is sufficient.
- Full-scenario speed test tools: can test sequential read/write, random read/write, different block sizes and test file sizes, suitable for detailed comparison.
- Hardware identification tools: used to check the connection hierarchy of USB devices, current negotiated rate, and port capabilities, to avoid plugging into the wrong port or using the wrong cable.
- Command line tools: controllable parameters and high repeatability, suitable for Linux, NAS, advanced users, and batch testing.
- System built-in rough test method: estimate by timing large file copies, low accuracy but no need to install software.
Below we have organized common free tools by platform, as well as the suitable groups of people:
| Platform | Tool Name | Type | Suitable For | Core Purpose |
|---|---|---|---|---|
| Windows | CrystalDiskMark | Full-scenario speed test | Most ordinary users | Test sequential read/write, 4K random read/write, results are easy to compare with online reviews |
| Windows | ATTO Disk Benchmark | Full-scenario speed test | Video/large file users | Observe speed changes under different block sizes, analyze differences between small and large files |
| Windows | USB Device Tree Viewer | Hardware identification | All users | Check which controller the device is connected to, current negotiated rate, whether it’s plugged into a high-speed port |
| Windows | File copy window | Rough test | Users who don’t want to install software | Roughly estimate real copy speed, greatly affected by cache and background |
| Mac | Blackmagic Disk Speed Test | Basic speed test | Mac beginners | Simple operation, intuitively displays continuous read/write and supported video formats |
| Mac | AJA System Test | Full-scenario speed test | Video users/cross-platform comparison | Can set test file size, more accurate for sustained write testing, supports Windows/Mac |
| Mac | AmorphousDiskMark | Full-scenario speed test | Users switching from Windows | Interface similar to CrystalDiskMark, familiar logic |
| Mac | System Report | Hardware identification | All users | Check USB device connection information, speed, and power supply, cannot directly test speed |
| Linux Desktop | KDiskMark | Full-scenario speed test | Linux desktop users | Interface similar to CrystalDiskMark, simple graphical operation |
| Linux/NAS | fio | Command line speed test | Advanced users/batch testing | Customizable parameters, reproducible results, incorrect parameters may damage data |
| Android | OTG identification tool + speed test App | Speed test + identification | Android users | First confirm device and port capabilities, then test speed, some phones have OTG speed limits |
| iOS/iPadOS | Files App copy timing | Rough test | Apple users | Third-party apps are limited by sandbox, can only represent file-level transfer performance |
If you don’t know what to choose, just pick according to this quick formula:
- Windows beginners: CrystalDiskMark + USB Device Tree Viewer
- Mac beginners: Blackmagic Disk Speed Test
- Video/large file users: AJA System Test or ATTO Disk Benchmark
- Linux desktop users: KDiskMark
- Linux/NAS/advanced users: fio
- Don’t want to install software: use the large file copy timing method
- Mobile OTG speed test: Android uses OTG identification + speed test App; iOS/iPadOS uses Files App copy timing to estimate
Pay attention to pitfalls when downloading: prioritize downloading from official websites, Microsoft Store, Mac App Store, and GitHub official repositories. Avoid cracked versions, bundled download sites, and unknown portable versions to prevent malware or tools that tamper with results. In addition, different tools have different algorithms. Don’t directly mix and rank the results of CrystalDiskMark, Blackmagic, and ATTO. When comparing, you must use the same tool, same version, and same parameters. Overseas users can prioritize tools with English interfaces, normal update frequency, and a large user base for more security.
4. Beginner’s Practice: How to Test Fairly and Accurately
Speed testing isn’t just clicking start and being done; you need to control variables well for the results to have reference value.
Pre-Test Preparation Checklist
Before starting the test, do these things first:
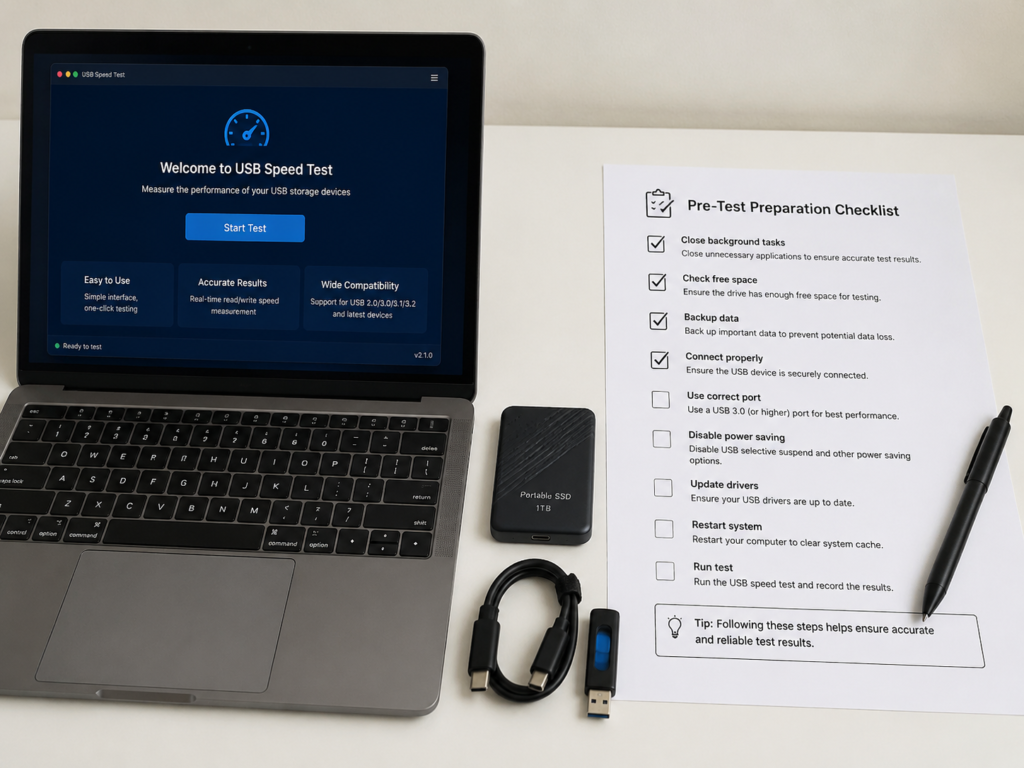
First, clarify what you want to compare: are you comparing devices, ports, cables, docking stations, or different systems? Only one variable can be changed per test. For example, when testing cables, the computer port and USB device must remain unchanged, otherwise you won’t know what caused the speed change.
Second, close interfering tasks: pause bandwidth or CPU-intensive tasks such as downloads, cloud sync, full antivirus scans, video exports, and game updates, otherwise they will affect the test results.
Third, confirm the remaining space of the device: it is recommended to keep at least 15%-20% free space on SSDs and USB drives. When space is too low, write speed may drop significantly.
Fourth, confirm the connection method: high-speed devices should preferably be plugged directly into the computer’s native port first, not through a HUB, docking station, monitor USB port, or extension cable, to avoid additional bottlenecks.
Fifth, back up important data: graphical file-level speed test tools usually only create temporary test files and will not damage existing data; but command line tools like fio and dd may overwrite the entire disk’s data if you select the wrong device path. Be sure to confirm the target drive before operating.
Standard Speed Test Steps for a Single Device
If beginners are testing a single device, follow these steps and you won’t go wrong:
Step 1: Open the tool, select the drive letter or volume name of the USB device you want to test from the target drive drop-down box. Be sure to confirm it’s not the system drive, local SSD, or other external drive. Many beginners select the wrong drive on their first test, and end up taking the local hard drive’s speed as the USB drive’s speed.
Step 2: Beginners can use the default parameters, such as 1GiB/1GB test file, 3-5 test runs, no need to change parameters randomly.
Step 3: During the test, don’t copy files, don’t plug or unplug the device, don’t let the computer sleep, and don’t touch the computer to avoid interference.
Step 4: After the test is complete, record the results of sequential read, sequential write, and 4K random read/write. It’s best to save a screenshot for later comparison.
Step 5: If you want to test sustained write capability (for example, if you often transfer large files), change the test file size to 5GB, 10GB, 32GB or even larger, test again, and observe if there is speed drop.
Rules for Fair Comparison of Multiple Objects
If you want to compare multiple objects (such as two cables, two ports, two USB drives), you must follow these rules for the results to be fair:
- Same tool: Use the same software, same version, and same set of parameters for the same round of comparison. You can’t use CrystalDiskMark for one and Blackmagic for another.
- Same environment: Same computer, same system state, same power mode, similar room temperature. For example, don’t test once plugged in and once on battery power saver mode.
- Same variable: When testing ports, only change the port, everything else stays the same; when testing cables, only change the cable, the device and port stay the same.
- Multiple tests: Test each object 2-3 times, take the average or record the stable range, to avoid accidental errors from a single test.
- Pay attention to hot/cold state: Portable SSDs will heat up during continuous testing, which may trigger thermal throttling, leading to lower subsequent test results. Record whether the test was done after continuous high load, or after the device has cooled down completely.
How to Record Results? Here’s a Template
If you test often, or need to compare multiple devices, you can make your own record table and write down all the key information, which is very convenient for troubleshooting later. You can refer to this template:
| Category | Field | Description |
|---|---|---|
| Basic Information | Device model, capacity | For example, “XX brand NVMe portable SSD 1TB” |
| Basic Information | Nominal USB version, cable nominal rate | For example, “USB 3.2 Gen2 10Gbps, 10Gbps USB-C cable” |
| Basic Information | Computer model, test port location | For example, “XX brand laptop left USB-C port” |
| Speed Information | Sequential read, sequential write | Take the average of multiple tests |
| Speed Information | 4K random read, 4K random write | Record when focusing on small file performance |
| Speed Information | Whether there is speed drop, minimum stable write speed | Record during large file testing |
| Environment Information | System version, power mode | For example, “Windows 11 22H2, High Performance mode” |
| Environment Information | Whether through HUB/docking station | Write “directly connected to native port” if direct |
| Environment Information | Remaining space, test file size, number of tests | For example, “30% remaining, 10GB, 3 times” |
| Environment Information | File system | For example, exFAT, NTFS, APFS |
| Judgment Information | Whether it meets expectations, possible bottleneck | For example, “Does not meet expectations, suspected cable bottleneck” |
| Judgment Information | Next verification action | For example, “Test again with a known high-speed cable” |
5. How to Interpret Results? Normal Ranges and Judgment Methods
You get a bunch of numbers from the test, how do you judge if they are reasonable? First, we’ll give you a reference for normal speeds of common combinations, then teach you how to troubleshoot problems.
Normal Speed Reference Range for Common Combinations
First, the prerequisites: this reference range is obtained under the conditions of qualified cable with corresponding rate, direct plug into native port, device remaining space ≥20%, room temperature, test file ≥1GB, not tested immediately after continuous high load. If using different tools, different file systems, encrypted drives, antivirus scanning, too high temperature, full cache, or low-cost devices with no nominal write speed, the results will deviate from this range and cannot be directly applied.
| Combination | Sequential Read (MB/s) | Sequential Write (MB/s) | Description |
|---|---|---|---|
| USB 2.0 + Ordinary USB Drive | 20-40 | 5-30 | The most common low-speed USB drive |
| USB 3.2 Gen1 + Low-end USB Drive | 30-80 | 10-30 | Many low-cost USB 3.0 drives have write speeds similar to USB 2.0 |
| USB 3.2 Gen1 + Mid-to-high-end USB Drive | 80-150 | 30-100 | Mainstream high-speed USB drive level |
| USB 3.2 Gen1 + SATA Portable SSD | 400-550 | 350-500 | Limited by SATA’s own upper limit |
| USB 3.2 Gen2 + SATA Portable SSD | 450-550 | 400-520 | Not much difference from Gen1, because SATA’s upper limit is here |
| USB 3.2 Gen2 + NVMe Portable SSD | 800-1100 | 700-1000 | Close to the upper limit of a 10Gbps port |
| USB 3.2 Gen2x2 + NVMe Portable SSD | 1500-2000 | 1400-1800 | Requires host, cable, and device all support 20Gbps, average compatibility |
| USB4/Thunderbolt 3/4 + NVMe Portable SSD | 2000-3500 | 1800-3200 | Limited by the NVMe drive itself, bridge chip, PCIe lanes, and heat dissipation |
| USB 3.x + Portable Mechanical Hard Drive | 80-160 | 80-160 | Limited by the mechanical hard drive itself, no matter how fast the port is |
Quickly Judge Whether the Result is Reasonable
If your test results are not in the above range, you can troubleshoot step by step according to these six steps:
Step 1: First check the units, confirm whether it’s MB/s, MiB/s, or Gbps. Many people misread the units and worry for nothing.
Step 2: Look at read and write separately. Manufacturers usually only label the peak read speed, and write speed may not be labeled or is much lower. Don’t compare the write result with the read nominal value.
Step 3: Check the negotiated rate. If a 10Gbps device only negotiates to 480Mbps, first suspect a problem with the cable, port, or HUB—this is the most common cause.
Step 4: When comparing with official nominal values, be sure to use the same tool, same set of parameters, and same test file size as much as possible, otherwise there is no comparability—manufacturers’ nominal values are usually measured under optimal conditions.
Step 5: Generally speaking, it’s normal if the read speed reaches 70%-90% of the official nominal value; if there is an official nominal write speed, reaching 60%-80% is common. For low-end USB drives and cache-based devices, you also need to judge combined with sustained write results.
Step 6: If the speed is lower than 50% of the nominal value, and you have excluded factors such as port, cable, HUB, background tasks, temperature, and cache, then consider whether the device has false labeling or quality problems, and you can contact the seller for after-sales service.
How to Identify Cache and Speed Drop
Many people encounter the “fast at first, then slow” situation: it’s very fast at the beginning of writing, and after a few GB, the speed suddenly drops. This is usually because the SLC cache is full, or the device temperature is too high and triggers throttling.
How to verify? Increase the test file size, such as 5GB, 10GB, 32GB, or directly copy a large video file of more than ten GB, and observe whether the speed in the second half stabilizes at a lower level.
Note here: if you often transfer large files (such as video footage, system backups), then the stable out-of-cache speed is what you should really pay attention to; if you only occasionally transfer a few small files, then the peak speed also has reference significance. Don’t use a small 100MB test result to judge the device’s sustained write capability—that’s most likely just the cache speed, and can’t represent the real large file transfer performance.
What User Experience Do Different Metrics Correspond To
You don’t have to memorize the metrics by rote, just match them to your usage scenarios:
- High sequential read: Faster to copy large files from external drive to computer, such as movies, games, compressed packages.
- High sequential write: Faster to write large files to external drive, such as backing up videos, transferring footage, copying games to external drive.
- High random read/write: Smoother processing of a large number of small files, such as office documents, photo folders, code projects.
- High IOPS: Better response for external system drives, game libraries, portable software, faster program opening.
- High stable write: More reliable for long-time recording, video editing material drives, regular large backups, won’t suddenly slow down halfway through transfer.
How to Estimate Large File Transfer Time
Once you know the stable write speed, you can estimate how long it will take to transfer large files without staring at the progress bar guessing. The basic formula is very simple:File size (MB) ÷ actual stable write speed (MB/s) ≈ required seconds
For example: a 100GB video is about 102400MB, if the stable write speed is 500MB/s, it will take about 205 seconds, which is about 3 and a half minutes.
If there are a lot of small files (such as thousands of photos, a bunch of documents), it’s usually slower than a single large file, you can add an extra 30%-100% of time to the estimated result. If the device has speed drop, the time for the second half should be calculated based on the stable speed after the drop, not the peak speed.
6. Advanced: How to Find the Speed Bottleneck
If the measured speed is wrong, how to find out where the problem is step by step? Troubleshoot in this order for the highest efficiency:
- First check the negotiated rate: Use USB Device Tree Viewer or System Report to see if the current connection speed is 480Mbps, 5Gbps, 10Gbps or higher. If the negotiated rate is wrong, it definitely won’t be fast—this is the most common problem.
- Then change the cable: Use a confirmed good high-speed cable, test again with the same device and same port. If the speed improves significantly, then the original cable is the problem.
- Then change the port: With the same device and same cable, switch to a confirmed high-speed port (such as the rear port on a desktop motherboard). If the speed improves, then the original port is not fast enough.
- Then bypass the HUB/docking station: Plug the device directly into the computer and test. If it’s faster than through the HUB/docking station, then there is a problem with the HUB or docking station’s upstream bandwidth, chip, or power supply.
- Then check the device’s upper limit: If the speed is already close to the official nominal value or the results of similar reviews, then it’s the upper limit of the device itself, and no amount of changing cables or ports will help.
- Finally check temperature and protocol: If it’s fast at first and slows down after a few minutes, it’s mostly thermal throttling; if random performance is particularly poor, check if the UASP protocol is not enabled and the old BOT protocol is used.
Common Abnormalities and Possible Causes
We’ve organized several of the most common abnormal situations and their possible causes:
- Speed far below nominal: Most likely plugged into a USB 2.0 port, used a USB 2.0 cable, passed through a low-speed HUB, and the device did not negotiate to high-speed mode.
- Particularly low write speed: May be a low-end USB drive, insufficient remaining space, full cache, too high temperature, or poor performance of the flash memory particles themselves.
- Large difference between two tests: Check if the test file size is different, if there are background tasks, if the power mode has changed, or if the device was still hot when the second test was done.
- Frequent disconnection or drive dropping: Check if there is insufficient power supply, poor cable contact, loose port, insufficient HUB power supply capability, or overheating of the device.
- Speed fluctuating up and down: May be caused by the combined effect of system cache, antivirus scanning, cloud sync, flash garbage collection, and thermal throttling.
These Easily Overlooked Influencing Factors
If you’ve checked all the above and it’s still wrong, you can look at these advanced factors:
- UASP vs BOT: UASP is a new transmission protocol that supports multi-queue and has better random performance; BOT is an old protocol with poor random performance, common in old devices and low-end hard drive enclosures.
- File System: exFAT is suitable for cross-platform mobile storage, no 4GB single file limit; FAT32 has a 4GB single file limit, suitable for small-capacity USB drives; NTFS, APFS, ext4 are suitable for their respective native systems, with better performance but poor cross-platform compatibility.
- Power Management and Power Supply: Laptop power saver mode, USB selective suspend function, front case USB ports, and HUBs without independent power supply may all cause speed fluctuations or drive dropping.
- Cable Length and Quality: High-speed cables have higher requirements for shielding and workmanship. The longer a passive high-speed cable is, the more likely it is to be unstable. Try to buy cables that are certified and clearly labeled with data rate.
- Docking Station/HUB Architecture: Many docking stations have multiple USB ports sharing the same upstream link. For example, a docking station with 10Gbps upstream, the total speed of all USB devices combined cannot exceed 10Gbps, it’s impossible for each port to run at full 10Gbps.
- Storage Medium and Heat Dissipation: The speed upper limits of mechanical hard drives, SATA SSDs, NVMe SSDs, and low-end flash USB drives are inherently different; portable SSDs with poor heat dissipation will trigger throttling protection under high load, and the speed will drop sharply.
Use Speed Test Results to Make Practical Decisions
Testing speed isn’t just for looking at numbers, it’s to help you make decisions:
- New device inspection: First eliminate chain bottlenecks (port, cable, HUB), then compare with official nominal values. If there is indeed a big difference, then consider after-sales service. Don’t just say the device is broken right away.
- Port allocation: Plug devices with high speed requirements such as portable SSDs, high-speed USB drives, and capture cards into high-speed ports. Low-speed devices such as keyboards/mice, printers, and headphone receivers can be plugged into ordinary ports, no need to waste high-speed ports.
- Cable upgrade: If the negotiated rate is low, or the speed improves significantly after changing to a high-speed cable, prioritize replacing with qualified cables clearly labeled with data rate, don’t just look at 100W/240W charging power.
- Docking station selection: If you often need to transfer multiple devices at the same time, pay attention to the docking station’s upstream bandwidth, whether it supports 10Gbps/20Gbps/USB4, and whether it has independent power supply. Don’t just look at the number of ports.
- Device upgrade: If the bottleneck is the USB drive or mechanical hard drive itself, then upgrading to high-speed ports and high-speed cables will have very limited improvement. Directly replacing with a portable SSD or higher-performance device is useful.
7. Comparison Focuses for Different Needs
Different usage scenarios have different focuses, you don’t need to test all metrics every time:
- New USB drive/portable hard drive/portable SSD inspection: Use CrystalDiskMark on Windows, Blackmagic or AJA System Test on Mac. Focus on sequential read, sequential write, whether there is speed drop, and negotiated rate. First compare with official nominal values and similar reviews, then troubleshoot port, cable, HUB, and temperature issues. Don’t just look at the USB version—many low-end USB 3.x drives have slower write speeds than portable mechanical hard drives.
- Large file backup and video material drive: Use AJA System Test, ATTO Disk Benchmark, or Blackmagic Disk Speed Test. Focus on sustained write speed, minimum stable speed, and thermal throttling under large test files. For this scenario, stably meeting video bitrate, backup window, and project import needs is far more important than short-term peak speed.
- Office USB drive and small file transfer: Use CrystalDiskMark to check 4K random read/write, or directly time real folder copying. Focus on 4K random read/write, IOPS, and copy time for a large number of small files. In scenarios with many small files, random performance affects experience more than sequential read peak. For example, transferring thousands of photos, no matter how fast sequential read/write is, it’s useless—if random is slow, you still have to wait a long time.
- USB port and cable comparison: Use the same speed test tool plus hardware identification tool, fix the same USB device, only change the port or only change the cable. Focus on negotiated rate, sequential read/write, and test stability. Generally speaking, a speed difference of more than 20% counts as a real difference, but each object must be tested at least 2-3 times to exclude the influence of temperature, background tasks, cache, and power mode.
- Docking station/HUB speed loss test: First test speed directly connected to the computer, then test through the docking station, and finally test the speed when multiple devices are working at the same time. Focus on the loss ratio of a single device, the situation of multi-device shared bandwidth, whether there will be disconnection, and whether power supply is sufficient. A single device loss of more than 30% may indicate that the docking station has bandwidth sharing, low chip specifications, low-speed cable, or insufficient power supply, but it’s not necessarily a quality problem—many entry-level docking stations are originally designed with shared upstream bandwidth.
- Mobile OTG transfer comparison: For Android phones, first confirm the USB port specifications and OTG support, then use a speed test App or large file copy to estimate; for iPhone/iPad, distinguish USB 2.0, USB 3, USB4/Thunderbolt capabilities according to the specific model, don’t just look at the port shape (for example, the iPhone 15 standard model is USB-C but only has USB 2.0 rate, only the Pro model supports 10Gbps). Focus on actual read/write speed, stability, whether there is disconnection, and heat generation. It’s common for mobile speed to be lower than computer speed, which may be caused by port specifications, system permissions, power strategies, or App restrictions, so don’t be too surprised.
8. Key Points for Making Your Own Comparison Table or Choosing Online Tools
If you often need to compare multiple devices, cables, or ports, either make your own comparison table or use an online USB speed comparison tool. A reliable comparison tool (or a table you make yourself) should include these functions and fields to help you compare accurately:
First are the core input items, the more complete they are, the more credible the results:
- Basic configuration: USB version, port shape, device type, cable specification, connection method, whether through HUB/docking station.
- Device information: Device model, capacity, nominal read, nominal write, purchase channel, official specification link.
- Test conditions: Test tool, test file size, number of tests, system version, power mode, file system, remaining space.
- Measured results: Sequential read, sequential write, 4K random read, 4K random write, stable write speed, negotiated rate.
It’s best to have built-in common presets, such as empirical speed ranges for common USB versions, device types, and cable specifications, to avoid manual input errors.
Then are the core output results. A good tool will give you conclusions directly, not just numbers:
- Theoretical speed conversion: Convert Gbps to theoretical MB/s, and at the same time mark the available bandwidth after encoding, clearly stating that actual transmission speed is not equal to the theoretical value.
- Common actual range: Display the empirical speed range for your combination, distinguishing between read, write, stable write, and random performance.
- Actual measurement rating: Such as “normal”, “low”, “obviously abnormal”, “suspected cache speed drop”, and also attach the basis and applicable conditions for the rating.
- Possible bottleneck prompts: Sorted by probability, for example, most likely a cable problem, followed by port, HUB, negotiated rate, cache, temperature, storage medium.
- Transfer time estimation: Input file size to estimate transfer time, supports small file correction and speed drop correction.
- Operation suggestions: Give next troubleshooting actions, such as “try changing to a high-speed cable”, “directly connect to native port”, “check negotiated rate”, “increase test file size”.
- Unit switching: Supports switching between MB/s, MiB/s, Gbps, to avoid unit confusion.
If it’s a multi-device comparison table, it should have these fields: basic fields (rank, device name, capacity, port/protocol, cable specification, connection method), speed fields (read speed, write speed, 4K random read/write, stable write speed, negotiated rate), auxiliary fields (test tool, test date, file system, remaining space, remarks). It’s best to have visual labels, such as “suitable for large files”, “suitable for small files”, “suspected USB 2.0 bottleneck”, “suspected cache speed drop”, “HUB shared bandwidth”, as well as filtering functions, which can filter by platform, USB version, device type, and speed range.
You can also write down the key calculation formulas behind it for your own calculations:
- Theoretical MB/s = Gbps × 125
- Available MB/s after USB 3.2 Gen1 encoding ≈ Theoretical MB/s × 80%
- Available MB/s after USB 3.2 Gen2/Gen2x2 encoding ≈ Theoretical MB/s × 97%
- Compliance rate = Measured speed ÷ Official nominal speed × 100%
- Speed loss ratio = (Direct connection speed – Speed through HUB/docking station) ÷ Direct connection speed × 100%
- Transfer time = File size (MB) ÷ Actual stable write speed (MB/s)
- Small file correction: The transfer time of a large number of small files can be increased by 30%-100% based on the estimated result
A good multi-device comparison function should support adding 2-5 comparison objects at the same time, which can compare devices, ports, cables, docking stations; automatically sort by sequential read, sequential write, random read/write, stable write, and mark the first place; automatically calculate the speed difference ratio between different objects; support exporting tables or images for easy saving and sharing; and can recommend the best choice according to usage scenarios, such as which one to choose for large file backup, which one for office small files, which one for game drive.
Finally, the rating rules should be objective and credible:
- Normal: The measured speed falls within the empirical range of the corresponding device type and chain combination, with no obvious bottleneck. It must be judged under the same tool, same parameters, and same environment.
- Low: Below the lower limit of the empirical range but not seriously deviated, first prompt to check cable, port, HUB, power supply, temperature.
- Obviously abnormal: About 50% below the lower limit of the empirical range, or the negotiated rate is obviously inconsistent, guide troubleshooting in the order of “negotiated rate → cable → port → direct connection → device”.
- Cache speed drop: Speed drops by ≥50% in the second half of the large file test, marked as suitable for short-term small file transfer, not suitable for sustained large file writing.
- Credibility prompt: If key information such as negotiated rate, test file size, and cable specification are not filled in, the rating should be marked as low credibility, for reference only.
Overseas users should also pay special attention: low-priced USB-C cables without rate labeling should be prompted first with the risk of USB 2.0 charging cables, don’t default to high-speed cables.
9. Pitfall Avoidance Guide: Common Misconceptions and Practical Reminders
Finally, we’ve organized the most common pitfalls for you. Avoid these, and you’ll be better than 90% of users.
Pitfalls in Tool Usage
- Don’t use USB speed test tools to measure charging speed: Data speed test tools can’t measure PD fast charging power, you need a dedicated power meter to test charging.
- Don’t select the wrong drive letter: Many beginners test the local SSD as a USB device, and the resulting speed is very high, thinking the USB drive is fast.
- Don’t draw conclusions after only one test: Background tasks, cache, and temperature may affect a single result. Test at least 2-3 times and take the average.
- Don’t use tools of unknown origin: Tools from cracked versions and bundled download sites may carry malware, or may tamper with results or pop up ads.
- Don’t randomly select devices with command line tools: Incorrect parameters for tools like fio and dd may write to the wrong disk and lose all data. Be sure to confirm the target drive before operating.
Pitfalls in Result Interpretation
- Don’t take the port’s nominal rate as the actual file transfer speed: The nominal value is the theoretical upper limit, and the file speed will definitely be lower than the theoretical conversion value, because of encoding, protocol, and system overhead.
- Don’t confuse Gbps with MB/s: 10Gbps is not 10000MB/s, the theoretical value is only 1250MB/s, and actual file transfer of around 1000MB/s is pretty good.
- Don’t directly rank results from different tools: Each tool has a different test model. For example, CrystalDiskMark and Blackmagic have different algorithms, so results can’t be directly compared horizontally.
- Don’t just look at peak speed: For large file backups and video material drives, you should pay more attention to the stable out-of-cache speed. No matter how high the peak is, it’s useless if the speed drops when the cache is full.
- Don’t assume the device is broken just because the write speed is low: Many USB drives, especially low-end ones, inherently have high read speed and low write speed. This is a problem of product positioning and cost, not necessarily a malfunction.
Pitfalls in Concepts
- Blue USB-A is not necessarily high-speed: Color is just a manufacturer’s habit, not a mandatory standard. Black can also be high-speed, and blue can also be USB 2.0.
- USB 3.2 is not necessarily faster than USB 3.1: USB naming has been changed several times. USB 3.2 Gen1 is the original USB 3.0/3.1 Gen1, both are 5Gbps, slower than USB 3.1 Gen2 (10Gbps). You need to look at the number after Gen.
- Fast charging cables don’t necessarily transfer data quickly: Charging power and data rate are two independent indicators. A 240W cable may also only have USB 2.0 data rate. When buying a cable, check carefully if it’s labeled with data rate.
- USB-C doesn’t necessarily support video output: USB-C is just the port shape. It needs DP Alt Mode, USB4, or Thunderbolt to support video output. Many cheap USB-C ports only have data and charging functions.
- USB4 is not necessarily equal to Thunderbolt 4: The two are technically related but not the same. Thunderbolt 4 usually has stricter certification requirements, USB4 may only have 20Gbps, and may not support Thunderbolt devices.
Practical Pitfall Avoidance Tips
- Before testing speed, check the official specifications and negotiated rate of the device, port, and cable first, don’t guess blindly.
- High-speed devices should preferably be plugged directly into the computer’s native port, try not to go through a docking station, HUB, monitor USB port, or extension cable.
- The same round of comparison must have unified tools, parameters, and environment, otherwise the comparison is meaningless.
- Don’t test when the device has very low remaining space, very high temperature, or many background tasks, the results will be inaccurate.
- When buying cables, look at the data rate label, don’t just look at 100W/240W charging power, otherwise you’ll probably buy a “data cable” that can only charge.
- When testing portable SSDs, do at least one large file sustained write test, don’t be fooled by short-term cache speed.
Frequently Asked Questions
What is the speed difference between USB 3.2 Gen1 and Gen2?
The nominal rate of USB 3.2 Gen1 is 5Gbps, and actual file transfer is about 400-500MB/s; the nominal rate of Gen2 is 10Gbps, and actual file transfer is about 800-1100MB/s, which is about twice that of Gen1. Note that you shouldn’t just look at the major version number “USB 3.2”, you need to look at the number after Gen.
Is a USB-C port necessarily faster than USB-A?
Not necessarily. USB-C is just the port shape; it may only support USB 2.0 (480Mbps), or it may support 5Gbps, 10Gbps or even higher; and USB-A can also be a high-speed USB 3.2 Gen2 (10Gbps) port. To judge speed, look at official specifications or negotiated rate, not just the shape.
How to test if a USB cable is a high-speed cable?
The simplest method is to use a known high-speed device (such as a 10Gbps portable SSD), plug it into a confirmed high-speed port, and test the speed with this cable. If the negotiated rate can reach 10Gbps and the speed is close to the device’s normal level, then it’s a high-speed cable; if the negotiated rate is only 480Mbps, then it’s a USB 2.0 cable.
What is the actual speed of a 10Gbps USB portable SSD?
Under the conditions of qualified cable, direct plug into native 10Gbps port, sufficient remaining space on the device, and normal temperature, the sequential read of an NVMe portable SSD is about 800-1100MB/s, and sequential write is about 700-1000MB/s; if it’s a SATA portable SSD, because SATA’s own upper limit is about 550MB/s, the speed difference from a 5Gbps port is not big.
What is the speed difference between USB4 and Thunderbolt 4?
USB4 has two common specifications: 20Gbps and 40Gbps, while Thunderbolt 4 usually requires 40Gbps, and also needs to meet stricter certification requirements such as PCIe bandwidth, video output, and security. Simply put, the lower speed limit of Thunderbolt 4 is 40Gbps, while USB4 may only have 20Gbps; but if both are 40Gbps specifications, the actual transmission speed difference is not big, mainly depending on the specific device implementation.
What to do if the USB drive write speed is very slow?
First troubleshoot if it’s a chain problem: Is it plugged into a USB 2.0 port, is the cable USB 2.0, is it going through a low-speed HUB, is the negotiated rate correct. If the chain is fine, then it may be a performance problem of the USB drive itself—many low-end USB drives have inherently slow write speeds, especially after the cache is full. In this case, you can only replace with a higher-performance USB drive or portable SSD. In addition, insufficient remaining space and too high temperature will also cause slower writing. You can first clean up space or wait for the device to cool down before trying again.
Will a docking station affect USB speed?
Most likely it will. The vast majority of docking stations have multiple USB ports sharing the same upstream bandwidth. For example, a docking station with 10Gbps upstream, the total speed of all USB devices combined will not exceed 10Gbps, and a single device may also have some loss due to the docking station’s chip, cable, power supply, etc. If you have high speed requirements, try to choose a docking station with high upstream bandwidth and independent power supply, and high-speed devices should preferably be plugged directly into the computer’s native port.
How to convert between Gbps and MB/s?
Theoretical conversion: 1Gbps = 125MB/s, that is, the Gbps value multiplied by 125 is the theoretical MB/s. But actual transmission also has encoding and protocol overhead. For example, USB 3.2 Gen1 (5Gbps) actually has about 400-500MB/s available, Gen2 (10Gbps) actually has about 800-1100MB/s available. Don’t directly apply theoretical values to actual file speeds.
Why do USB-C fast charging cables transfer files very slowly?
Because charging power and data