
Everything You Need to Know About Thermal Testing for Chargers, Appliances and Electrical Equipment
Quick Summary
- Definition: Temperature rise (ΔT) measures how much hotter a device gets during operation compared to the surrounding air, not its absolute surface temperature.
- Core purpose: It prevents fire hazards, extends device lifespan, validates cooling designs, and ensures compliance with global safety standards.
- Three mainstream methods: Thermocouple (gold standard for certification), resistance method (for windings), and thermal imaging (for hot-spot scanning).
- Key standards: IEC 62368-1, IEC 60335-1, UL 62368-1, with different stability rules and limit values.
- General rule of thumb: Most consumer devices reach thermal stability when temperature changes by less than 1°C over 30 minutes, but exact requirements vary by standard.
1. What Is a Temperature Rise Test?
1.1 Core Definition of Temperature Rise
Temperature rise describes the gap between a component’s operating temperature and the ambient air temperature around it. It measures how much heat the device itself generates, rather than how hot it feels in a warm room.
1.2 Calculation Formula & Key Parameters
The core formula is straightforward:
ΔT (Temperature Rise) = Operating Temperature − Ambient Temperature
For example:
- If ambient air is 25°C and a charger surface reaches 55°C, the temperature rise is 30 K.
- If ambient air rises to 40°C and the same charger reaches 70°C, the temperature rise is still 30 K.
This is why engineers track ΔT instead of absolute temperature: it isolates the device’s own heat generation from environmental conditions.
1.3 Temperature vs. Temperature Rise: What’s the Difference?
- Absolute temperature tells you how hot something feels right now.
- Temperature rise tells you how much heat the device is producing on its own.
Two devices with the same surface temperature can have very different thermal performance if tested in different rooms. Rise values make comparisons fair.
1.4 Why Do Electronic Devices Generate Heat?
All heat comes from energy loss during operation:
- Joule heating (I²R loss): When electric current flows through resistance, it creates heat — like friction in a pipe slowing down water. Wires, connectors and windings all produce this type of heat.
- Switching loss: Power transistors turn on and off thousands of times per second. Each switch wastes a tiny bit of energy, which adds up to noticeable heat.
- Magnetic loss: Transformers and inductors waste energy as heat in their core materials.
In short: every electronic device wastes some power, and all wasted power turns into heat.
1.5 The Three Ways Heat Moves
Understanding heat transfer helps you see why cooling designs work:
- Conduction: Heat travels through solid materials. A metal spoon in hot tea warming up its handle is conduction.
- Convection: Heat is carried away by moving air or liquid. A fan blowing hot air out of a laptop uses convection.
- Radiation: Heat travels as infrared waves, like the warmth you feel from sunlight.
2. Why Temperature Rise Testing Matters
2.1 Protecting User Safety
Uncontrolled heat causes real risks:
- Burn injuries from hot surfaces
- Melting or warping of plastic parts
- Insulation breakdown that leads to electric shock
- Fire hazards in severe cases
2.2 Extending Device Lifespan
A widely accepted rule in electronics: for every 10°C increase in operating temperature, the lifespan of semiconductors and insulation is roughly cut in half. A well-controlled temperature rise means years of extra reliable service.
2.3 Meeting Compliance & Certification Requirements
Temperature rise testing is a mandatory step for global market access. It falls under broader regulatory frameworks like CE (EU) and FCC (US), which reference specific test standards such as IEC 62368-1 and IEC 60335-1. Products that fail these tests cannot be legally sold in most markets.
2.4 Validating Cooling Design Performance
Engineers use rise test data to answer practical questions:
- Is the heat sink big enough?
- Does the thermal paste work as expected?
- Are ventilation holes positioned correctly?
It turns guesswork into measurable data.
3. Applications & Common Products
3.1 Consumer Electronics
- USB-C chargers and GaN fast chargers
- Laptop power adapters
- Power banks and wireless chargers
- Gaming consoles and PC power supplies
3.2 Household Appliances
- Kettles, coffee makers and kitchen appliances
- LED lighting and drivers
- Hair dryers and space heaters
- Refrigerators and air conditioners
3.3 Power & Industrial Equipment
- Electric motors and generators
- Power transformers
- Low-voltage switchgear and busbars
- Industrial power supplies
3.4 New Energy & Other Fields
- EV chargers and battery packs
- Solar inverters
- Data center server racks
- Automotive electronic components
4. Key International Standards
4.1 IEC Standard System (Global)
Direct temperature-rise standards:
- IEC 62368-1: Safety standard for IT, audio and video equipment — the most common standard for USB-C chargers and consumer electronics.
- IEC 60335-1: General safety standard for household appliances, with strict touch-temperature rules.
- IEC 60076-2: Dedicated standard for power transformer temperature rise testing.
- IEC 61439: Temperature rise verification for low-voltage switchgear assemblies.
Supporting standards:
- IEC 60085: Defines insulation thermal classes (A, E, B, F, H).
4.2 UL & North American Standards
- UL 62368-1: North American equivalent of IEC 62368-1 for IT/AV equipment.
- UL 60335-1: Safety standard for household appliances sold in the US and Canada.
- UL 94: Flammability rating for plastic materials, used alongside thermal tests to evaluate fire risk.
4.3 Industry-Specific Standards
- NEMA MG 1: For industrial electric motors.
- IPC-TM-650: For printed circuit board assemblies.
- SAE J1455: For automotive electronic components.
4.4 Key Differences Between Standards
- Ambient reference: Most use 25°C for consumer goods, while industrial standards often use 40°C.
- Stability criteria: IEC 62368-1 defines stability as <3 K change over 30 minutes (or <1 K over 5 minutes if temperatures are well below limits), while IEC 60335-1 uses longer observation windows.
- Touch limits: Household appliance standards have stricter rules for surfaces held by hand.
- Altitude correction: Most standards require derating above 2000 meters due to thinner cooling air.
5. Test Equipment & Tools
5.1 Temperature Measurement Devices
- Type K/T thermocouples: The workhorse of most test labs. Low cost, high accuracy (around ±1°C), and usable on almost any surface.
- PT100/PT1000 RTD sensors: Higher precision platinum sensors for ambient monitoring and reference points.
- Infrared thermal cameras: Non-contact tools that map full-surface temperature patterns to find hidden hot spots.
- Precision multimeters: Used with the resistance method to measure winding temperature.
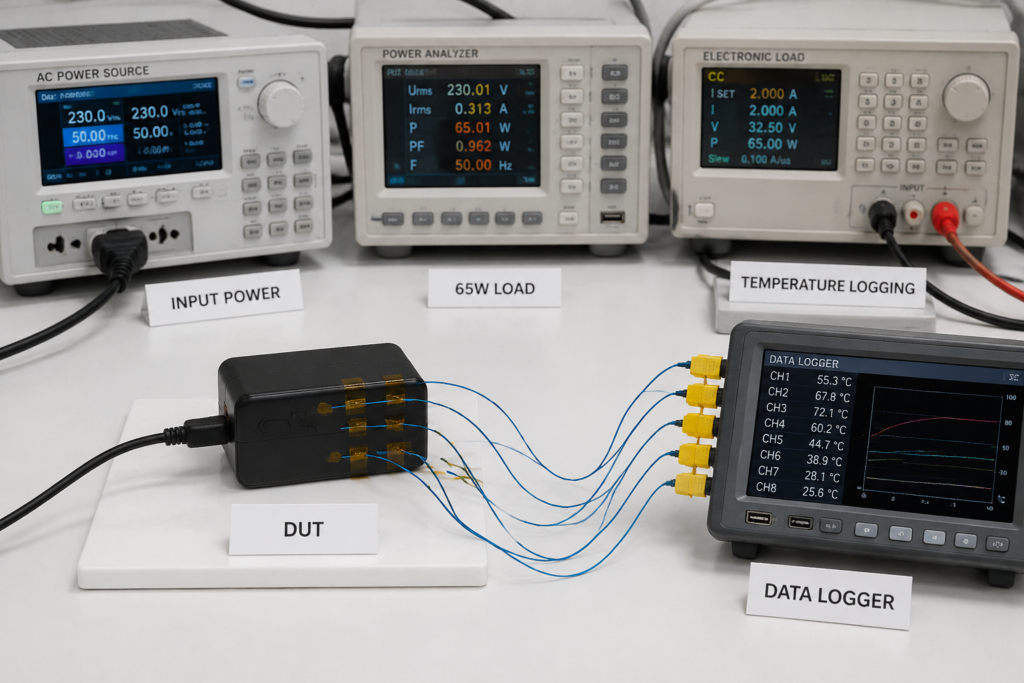
5.2 Electrical Test Equipment
- Programmable AC/DC power supplies: Deliver precise input voltage, including upper/lower limit tests.
- Electronic loads: Simulate real-world device power draw from light load to full load.
- Power analyzers: Measure input power, output power and conversion efficiency in real time.
5.3 Environmental Control Equipment
- Temperature test chambers: Maintain a stable 25°C or 40°C ambient for repeatable results.
- IEC black test corner: A standardized wooden enclosure required by IEC 60335-1 to simulate real-world wall-mounted conditions.
- Multi-point ambient sensors: Average air temperature around the test sample.
5.4 Auxiliary Tools & Consumables
- High-temperature Kapton tape and thermal adhesive for mounting thermocouples
- Thermocouple welding machines for making fine-junction sensors
- Thermal paste and gap pads for interface testing
5.5 Test Software & Analysis Platforms
- Multi-channel data logging software with configurable sample rates
- Thermal curve analysis tools for stability detection
- Thermal image processing software for hot-spot mapping
- Automated report generation tools for certification documentation
6. Core Test Methods & How to Choose
6.1 Thermocouple Method
How it works: Two different metals joined at one end produce a tiny voltage that changes with temperature (the Seebeck effect).
- Pros: High accuracy, low cost, accepted by all certification bodies
- Cons: Requires direct contact; can slightly affect local cooling
- Best for: Surface temperatures, component case temperatures, connector and PCB hot spots
6.2 Resistance Method
How it works: Metal wire resistance increases predictably with temperature. By comparing cold and hot resistance, you calculate average winding temperature.
- Pros: Measures internal winding temperature without disassembling the part; does not disturb heat flow
- Cons: Only works on conductive windings; cannot locate single hot spots
- Best for: Motor windings, transformer coils, inductors
6.3 Infrared Thermal Imaging
How it works: A camera detects infrared radiation emitted by surfaces and converts it into a color temperature map.
- Pros: Non-contact, fast, instantly shows full temperature distribution
- Cons: Affected by surface emissivity; cannot see internal temperatures; lower accuracy
- Best for: Hot-spot discovery, quick screening, airflow analysis
6.4 Other Supporting Methods
- Fiber-optic sensors: For high-voltage or electromagnetically noisy environments
- Built-in NTC thermistors: Used for real-time monitoring inside finished products
- Calorimetry: Measures total heat output in a sealed chamber
6.5 Method Selection Guide
| Method | Accuracy | Contact Type | Cost | Best Use Case | Certification Status |
|---|---|---|---|---|---|
| Thermocouple | High (±1°C) | Contact | Low | Most components & surfaces | Gold standard |
| Resistance | Medium | Indirect | Medium | Motor/transformer windings | Standard for windings |
| Thermal imaging | Medium–low | Non-contact | High | Surface mapping & hot-spot search | Supplementary only |
| Built-in sensors | High | Embedded | Medium | Long-term monitoring | Reference only |
7. Step-by-Step Standard Test Procedure
7.1 Pre-Test Preparation
- Select a representative production sample and remove protective films.
- Verify the sample works normally and has no pre-existing damage.
- Confirm the applicable standard, pass/fail limits and worst-case test conditions.
- Calibrate all temperature channels and record cold-state baseline readings.
7.2 Measurement Point Layout & Sensor Installation
Place sensors on the highest-risk locations:
- Power semiconductors (MOSFETs, GaN FETs, control ICs)
- Transformer windings and cores
- High-current PCB traces and terminal blocks
- Heat sink surfaces
- Outer casing areas touched by users
- Insulating materials near heat sources
Secure thermocouples with thermal adhesive or high-temperature tape. Use fine-wire thermocouples on small components to avoid drawing heat away.
7.3 Test Environment Setup
- Place the sample in its normal operating orientation, at least 100 mm from chamber walls.
- Maintain stable ambient temperature (typically 25°C ±5°C).
- Block direct sunlight and drafts.
- Record ambient humidity and air pressure for altitude correction if needed.
7.4 Load Application & Live Monitoring
- Apply the rated voltage (or the upper/lower limit specified by the standard).
- Apply the full rated load — the worst-case condition that produces maximum heat.
- Start continuous data logging.
- Visually inspect for smoke, unusual odors, deformation or functional faults.
7.5 Thermal Stability Judgment
A test reaches stability when temperatures stop climbing.
- General engineering rule: Less than 1°C change over 30 minutes.
- IEC 62368-1 rule: Less than 3 K over 30 minutes, or less than 1 K over 5 minutes if temperatures are at least 10% below limits.
- Large equipment: Transformers and motors may require hours or even a full day to stabilize.
Never speed up a test by increasing power — it distorts heat distribution and produces invalid results.
7.6 Post-Test Wrap-Up
- Cut power and immediately take hot-state resistance readings if using the resistance method (windings cool fast, usually within 30 seconds).
- Record final stable temperatures for all channels.
- Recheck the sample for functionality and physical damage.
- Calculate ΔT values and correct ambient temperature to the standard reference value.
7.7 Handling Test Abnormalities
If any of these occur, stop the test immediately:
- Temperature keeps climbing without stabilizing
- Output voltage/current becomes unstable
- Over-temperature protection triggers repeatedly
- Visible smoke, melting or burning odor appears
8. Test Conditions & Parameter Setup
8.1 Electrical Parameters
- Voltage: Rated voltage, plus upper limit (+10%) and lower limit (−10%) for worst-case verification.
- Frequency: Rated 50 Hz or 60 Hz as marked on the product.
- Load: 100% rated load for normal testing; some standards require 1.1× overload for safety evaluation.
8.2 Environmental Parameters
- Standard ambient: 25°C for most consumer electronics tests.
- High-temperature test: 40°C for industrial or harsh-environment products.
- Humidity: Non-condensing, typically ≤70% RH.
- Altitude: Derate ratings above 2000 m above sea level.
8.3 Operating Modes
- Continuous operation mode
- Intermittent duty cycle
- Short-time operation
- Fault or abnormal condition (required by safety standards)
8.4 Data Sampling Rules
- Sample every 1–5 minutes during the fast-ramp phase.
- Widen to 10–15 minute intervals once approaching stability.
- Continue logging for at least 30 minutes after stability is reached.
8.5 Sample Mounting Orientation
How you place the device changes results dramatically:
- Upright, flat or wall-mounted position per product design
- Distance from walls or surrounding surfaces
- Cable routing and connector orientation
- Air inlet/outlet blockage status
Always test in the orientation that produces the highest temperatures.
9. Data Analysis & Test Report
9.1 Raw Data Processing & Correction
- Adjust readings to the standard reference ambient temperature for fair comparison.
- Remove sensor drift and calibration offsets.
- Apply cold-junction compensation for thermocouple data.
9.2 Temperature Curve & Key Metrics
From the recorded data, engineers extract:
- Maximum temperature rise value (ΔT max)
- Time required to reach thermal stability
- Initial ramp-up speed
- Any overshoot or oscillation patterns
9.3 Hot-Spot Localization Analysis
- Identify the single hottest point on the device — this point determines lifespan and safety.
- Map temperature gradients across the PCB or casing.
- Trace heat flow paths to see where cooling is bottlenecked.
- Cross-reference thermal images with thermocouple data for accuracy.
9.4 What a Formal Test Report Includes
- Full product identification and sample information
- Applicable standard and test method statement
- Ambient conditions and test setup photos
- Measurement point location diagram
- Temperature rise curves for all channels
- Maximum rise values vs. standard limits
- Final pass/fail conclusion
10. Temperature Rise Limits & Pass/Fail Criteria
10.1 Insulation Thermal Class System (IEC 60085)
Insulation materials are rated by how much heat they can survive long-term. Limits below are based on 40°C ambient:
| Insulation Class | Max Total Temperature | Typical Winding Rise Limit | Common Materials |
|---|---|---|---|
| Class A | 105°C | 60 K | Cotton, paper, natural resins |
| Class E | 120°C | 75 K | Polyester film, high-grade enamel |
| Class B | 130°C | 80 K | Mica, glass fiber with binder |
| Class F | 155°C | 105 K | Epoxy resin, advanced varnish |
| Class H | 180°C | 125 K | Silicone resin, polyimide |
10.2 Typical Temperature Rise Reference Values
These are general reference ranges — always check the exact standard:
- Touchable plastic surfaces: 30–50 K rise
- Touchable metal surfaces: 30–40 K rise (lower because metal conducts heat to skin faster)
- Terminal blocks and connectors: 45–60 K rise
- PCB copper traces: 40–60 K rise, depending on current density
10.3 Touch Temperature & Burn Safety
Limits depend on material and contact duration:
- Metal surfaces feel hotter faster and have lower allowable temperatures.
- Plastic surfaces can run slightly warmer because they transfer heat more slowly to skin.
- Surfaces only touched briefly have higher limits than surfaces held continuously.
10.4 Failure Criteria
A test fails if:
- Any measured point exceeds the standard’s temperature rise limit.
- The sample malfunctions or triggers protection during normal operation.
- Visible deformation, discoloration or material degradation appears.
- Any safety-critical component fails.
Most good designs keep a 10–20% safety margin below the limit.
11. Real-World Test Case Studies
11.1 65W GaN USB-C Charger Test
Setup: 25°C ambient, full 65W load, tested on a wooden bench in free air.
Results:
- Casing peak temperature: 58–65°C after 60 minutes
- Internal GaN FET case temperature: 88–95°C
- Temperature rise: ~33–40 K on surface, ~63–70 K on the switch Conclusion: Passed IEC 62368-1 limits with good safety margin. Upgrading the thermal pad reduced peak component temperature by 12°C in a follow-up design iteration.
11.2 Industrial Motor Winding Test
Setup: 40°C ambient, continuous rated load, resistance method on stator windings.
Issue: Winding temperature rise reached 92 K, exceeding the Class B 80 K limit.
Root cause: Phase current imbalance caused extra heating in one winding.
Fix: Balanced the supply phases and improved terminal connections. Rise dropped to 76 K, passing the standard.
11.3 Oil-Immersed Distribution Transformer
Observation: Top-oil temperature rose higher than expected during summer peak load.
Risk: Accelerated insulation aging — every 8–10°C extra roughly halves transformer life.
Action: Cleaned cooling fins, improved ventilation and adjusted load scheduling. Hot-spot temperature returned to safe operating range.
12. Deep Dive: USB-C & GaN Charger Thermal Performance
12.1 Temperature Rise by Power Level
- 20–30W phone chargers: Low thermal stress. Surface stays warm but not hot, typically 38–45°C in 25°C room.
- 65W laptop chargers: Noticeable warmth. Well-designed units stay under 65°C on the casing.
- 100–140W high-power chargers: Significant heat output. Good thermal design is critical.
- 240W PD 3.1 EPR chargers: Highest power density. Cooling design separates premium models from budget ones.
12.2 GaN vs. Traditional Silicon Chargers
GaN (gallium nitride) transistors have lower switching losses than old silicon MOSFETs — but that does not automatically mean a GaN charger runs cooler.
- GaN advantage: Less waste heat per watt, and much smaller size for the same power.
- GaN trade-off: Smaller casing means less surface area to dissipate heat, so heat density can be higher.
- Final result: A well-designed GaN charger usually matches or beats a silicon charger thermally, but a cheap poorly engineered GaN model can run hotter.
12.3 Where Chargers Get Hottest
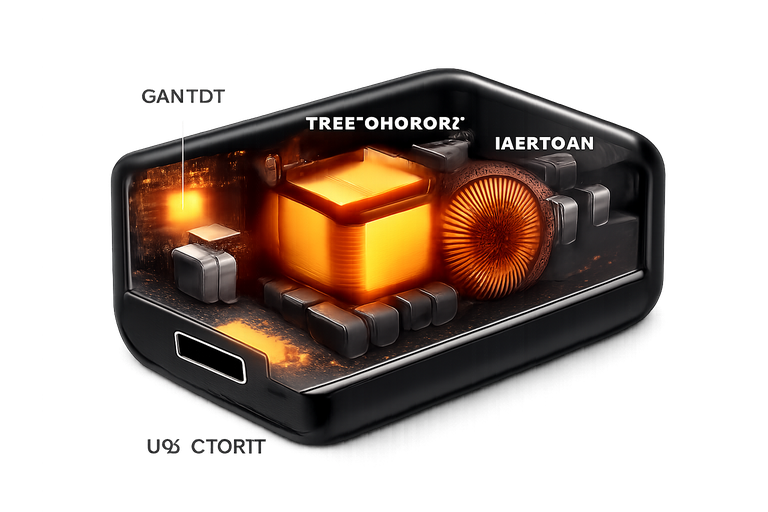
Inside a typical charger, heat concentrates in:
- The main power switch (GaN FET or silicon MOSFET)
- The high-voltage transformer
- Output rectifiers and inductors
- The USB-C connector at full current
On the outside, the hottest spot is usually near the plug prongs or above the transformer position.
12.4 User Guide: Is Your Charger Temperature Normal?
Normal behavior:
- Feels warm to the touch, but you can hold it comfortably.
- Temperature stabilizes and does not keep climbing.
- No unusual smell, discoloration or crackling.
Warning signs:
- Too hot to hold for more than a few seconds.
- Plastic feels soft or looks deformed.
- Burning or chemical odor.
- Charging cuts in and out randomly.
If you see warning signs, stop using the charger immediately and replace it with a certified model.
13. Causes of High Temperature Rise & Optimization Solutions
13.1 Main Factors Affecting Results
- Design factors: Heat sink size, PCB layout, component selection, thermal path design.
- Electrical factors: Overload, high contact resistance, phase imbalance, harmonic distortion.
- Environmental factors: High ambient temperature, blocked vents, dust buildup.
- Test factors: Wrong sensor placement, insufficient test time, unstable ambient.
13.2 Common Reasons for Exceeding Limits
- Heat sink is too small or poorly shaped.
- Thermal interface material is thin or unevenly applied.
- Air vents are blocked or airflow paths are poorly designed.
- Components are not sufficiently derated.
- Connector or terminal contact resistance is too high.
- The enclosure is sealed too tightly for natural convection.
13.3 Practical Cooling Optimization Paths
- Improve efficiency: Switch to GaN or SiC devices, use soft-switching topologies, add synchronous rectification. Less waste heat is always the best fix.
- Enhance heat spreading: Larger heat sinks, thicker copper on PCB, metal case design.
- Upgrade thermal interfaces: Better thermal paste, gap pads or graphite sheets.
- Improve airflow: Add ventilation holes, optimize ducting, or add a fan for very high power.
- Smart power management: Dynamically reduce power when temperatures approach limits.
14. Common Misconceptions
14.1 “Higher power always means hotter”
Not true. Efficiency and cooling design matter more. A well-built 65W GaN charger can run cooler than a badly designed 30W silicon charger.
14.2 “If the case feels cool, the inside is safe”
Wrong. The hottest components inside can be 30–50°C hotter than the outer surface. A cool casing does not guarantee a cool interior.
14.3 “Smaller chargers must have worse cooling”
Not necessarily. GaN technology and advanced thermal materials let engineers build small chargers with excellent thermal performance. Size alone does not determine temperature rise.
14.4 “Infrared thermometers can replace thermocouples for certification”
No. Thermal cameras are great for finding hot spots, but their accuracy is not high enough for formal certification testing. Thermocouples remain the reference method.
14.5 “You can speed up testing with extra power”
Never. Overpowering changes the heat distribution pattern and gives false results. Proper testing always runs at rated conditions and waits for natural equilibrium.
15. Frequently Asked Questions (FAQ)
Q: What is the difference between temperature and temperature rise?
A: Temperature is how hot something is right now. Temperature rise is how much hotter it gets than the surrounding air. Rise tells you how much heat the device itself produces.
Q: How long does a typical temperature rise test take?
A: Most consumer electronics take 4–8 hours to fully stabilize. Large equipment like transformers or big motors can take 24 hours or more.
Q: Can I use an infrared thermometer instead of thermocouples for certification?
A: No. Infrared tools are excellent for screening and hot-spot hunting, but only contact methods like thermocouples and resistance testing are accepted for formal certification.
Q: Is it normal for my USB-C charger to get warm?
A: Yes, some warmth is normal and expected. All chargers waste a small percentage of power as heat. It becomes a problem only if it is too hot to hold, smells odd, or shuts down randomly.
Q: Does room temperature affect test results?
A: Yes, but proper testing corrects for it. Engineers measure temperature rise, not absolute temperature, so results can be adjusted to a standard 25°C or 40°C reference.
Q: Can you accelerate a temperature rise test?
A: Not reliably. Cranking up the power changes where heat flows and produces misleading numbers. The only valid way is to run at real rated conditions and wait for stability.
16. Future Trends
16.1 Next-Generation Power Devices
GaN and silicon carbide (SiC) transistors will keep pushing efficiency higher and losses lower. Future chargers and power supplies will produce less waste heat per watt, even as power ratings climb.
16.2 Smart Thermal Management
AI-powered thermal control will dynamically adjust power, fan speed and charging speed based on real-time temperature data. This will keep devices safe without sacrificing performance when cooling is good.
16.3 The High-Power Consumer Electronics Challenge
As 140W and 240W USB-C becomes standard for laptops and even monitors, thermal design will be a key competitive feature. Companies that master compact, cool-running high-power designs will lead the market.
17. Final Thoughts
Temperature rise testing is much more than a checkbox on a certification form. It is the bridge between electrical theory and real-world safety. For consumers, it means chargers and appliances that do not overheat, last longer and reduce fire risk. For engineers, it is the tool that turns thermal design ideas into measurable, reliable products.
Whether you are shopping for a new GaN charger, designing a power supply or studying electrical safety, understanding temperature rise gives you a clearer view of what makes electronics safe, durable and efficient.