
Introduction
If you have ever set your phone on a wireless charging pad and returned an hour later to find it barely gained battery, you have encountered the quiet gap between advertised wattage and real-world performance. Wireless charging offers unmatched convenience — no fumbling with cables, no worn-out ports, just set and charge — but what happens to all that power between the wall socket and your phone battery remains invisible to most users.
Wireless charging efficiency testing turns that invisible energy flow into measurable, comparable data. It reveals how much input power actually reaches your device, how much is lost as heat, and why two chargers with the same 15W rating can deliver drastically different charging speeds. This guide breaks down the basics of wireless charging efficiency, explains where energy is lost, walks through standardized lab testing procedures, compares different product types, and shares practical tips to help you choose and use wireless chargers more effectively.
1. Core Concepts: Understanding Wireless Charging Efficiency
Before diving into testing methods and standards, it helps to clarify what efficiency actually means, and how it differs from the charging speed numbers most shoppers focus on.
1.1 Definition and Calculation
At its simplest, wireless charging system efficiency measures the ratio of usable power delivered to the receiving device against the total power drawn by the charging pad from the power source. The core formula is:
System Efficiency = (Actual Output Power at Receiver ÷ Input Power at Transmitter) × 100%
An important distinction often missing from marketing materials is the difference between coil-level transmission efficiency and full-system efficiency. Coil-level efficiency only measures energy transfer between the two coils, ignoring losses in power conversion circuits. Full-system efficiency counts every loss from the wall plug to the device’s charging management system, which is the number that matters for real-world use.
It is also critical to separate efficiency from charging speed. Charging speed describes how many watts of power are delivered. Efficiency describes what percentage of input power becomes useful output. A high-wattage charger with low efficiency can waste more energy and produce more heat than a lower-wattage, well-designed model.
1.2 Key Terms Explained
- Transmitter (Tx): The charging pad, stand, or dock that sends power wirelessly.
- Receiver (Rx): The coil, rectifier circuit, and charging management module built into the phone, watch, or earbud case.
- Standby power: The small amount of electricity the charging pad consumes when no device is placed on it.
- Magnetic coupling coefficient: A measurement of how well the transmitter and receiver coils align magnetically to transfer energy.
1.3 Goals of Efficiency Testing
Professional efficiency testing serves four main purposes:
- Quantify total energy loss across the full charging chain to verify real-world performance.
- Measure how stable efficiency remains across different placement positions, distances, and load levels.
- Enable fair side-by-side comparison between products and help identify exaggerated power claims.
- Establish the relationship between efficiency, heat generation, and long-term operational safety.
2. Why Wireless Charging Efficiency Testing Matters
For casual users, efficiency might seem like an engineering detail. In practice, it shapes almost every part of the wireless charging experience.
2.1 The Gap Between Advertised and Actual Power
It is extremely common for a wireless charger marketed as 15W to deliver only a fraction of that power to the actual phone battery. Losses accumulate at every stage of the energy path, so the number printed on the box describes input capability, not what reaches your device. Efficiency, not headline wattage, is the more reliable indicator of real charging speed.
2.2 Energy Cost and Long-Term Consumption
In regions with higher electricity prices, consistently low-efficiency charging adds extra energy consumption and usage costs over time. Even small per-charge waste adds up across months and years of daily use, especially for chargers left plugged in around the clock. Standby power draw, though small per hour, also contributes to annual energy waste.
2.3 Heat Generation and Device Longevity
Virtually all lost energy in a wireless charging system turns into heat. That heat warms both the charging pad and the phone battery. Sustained high temperatures accelerate the aging of internal components and degrade battery health over time. In severe cases, excess heat triggers built-in thermal protection, which reduces charging power and slows down the process even further — creating a cycle of lower efficiency, more heat, and slower charging.
2.4 Global Compliance and Environmental Considerations
Some countries and regions set requirements for energy efficiency, standby power consumption and safety performance of electronic devices, and wireless charging products must meet corresponding regulations and certification standards. Higher energy efficiency also aligns with global carbon reduction goals, making efficient charging a meaningful part of low-impact tech consumption.
3. How Wireless Charging Works and Where Energy Is Lost
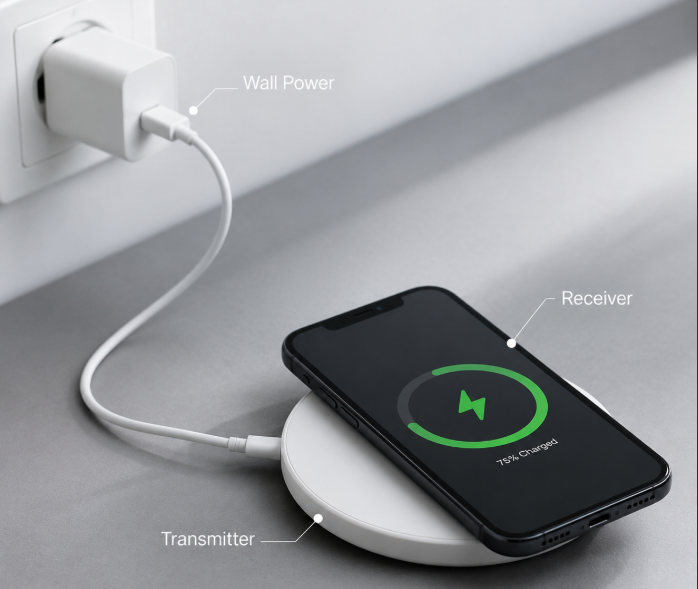
To understand why efficiency varies so much between products, it helps to trace the full energy path from wall socket to battery. Every step along the way loses a small amount of energy, and those losses add up.
3.1 Core Technology Types
Two main wireless charging technologies exist in consumer products today:
- Electromagnetic induction: The dominant technology in phones and consumer devices. It uses tightly coupled magnetic coils to transfer energy over very short distances. It delivers relatively high peak efficiency but requires very precise coil alignment.
- Magnetic resonance: A less common technology that works over slightly longer distances and tolerates more misalignment. It offers greater placement freedom but generally has lower peak efficiency.
3.2 Front-End Power Supply Losses
Energy loss starts before the wireless transfer even begins. The wall adapter that converts household AC power to low-voltage DC power has its own efficiency losses. The connecting cable also adds small resistive losses and voltage drop, especially with low-quality cables.
3.3 Transmitter-Side Losses
Inside the charging pad, the DC power is converted back into high-frequency alternating current to drive the transmitting coil. This inverter circuit produces both switching losses and conduction losses. The transmitting coil itself also generates heat from electrical resistance, particularly at high frequencies. Control circuits and driver chips add a smaller but constant baseline loss.
3.4 Air-Gap Coupling Losses
This is where the largest efficiency differences appear in real use. When the coils are perfectly centered and very close together, magnetic coupling is strong and losses are low. Horizontal offset, angular tilt, or increased distance between the coils weakens the magnetic coupling and lets more energy disperse into the surrounding air instead of reaching the receiver. Intermediate materials like phone cases, and especially metal objects, can absorb or deflect magnetic energy, adding even more loss.
3.5 Receiver-Side Losses
On the device side, the receiving coil has its own resistance losses. The received alternating current must then be rectified and regulated into stable DC power for the battery, which adds another layer of conversion loss. Finally, the phone’s internal charging management system consumes a small amount of power to control charging speed and protect battery health.
4. Global Standards and Certification Framework
Wireless charging efficiency is not an unregulated wild west. A set of industry standards and regional certification programs define testing methods and baseline performance expectations.
4.1 WPC Qi Standard System
The Wireless Power Consortium (WPC) develops the Qi standard, the most widely adopted wireless charging specification worldwide.
- Qi 1.3 standard: defines testing procedures, compatibility requirements, and related performance verification methods for wireless charging products. It also strengthened security authentication and foreign object detection rules.
- Qi2 standard: integrates magnetic positioning technology to improve alignment consistency and sets higher requirements for efficiency stability. It uses the Magnetic Power Profile (MPP) derived from MagSafe technology.
- Qi2.2 standard: adds a 25W high-power tier with updated efficiency and thermal management testing specifications.
4.2 Regional Regulatory Requirements
- United States: FCC Part 15 sets radio frequency compliance rules, and UL safety standards include provisions related to thermal performance and safe operation.
- European Union: The CE-RED directive and EN 303 417 standard cover electromagnetic compatibility and performance requirements for wireless charging equipment.
- Japan: The MIC certification and PSE system include radio frequency and safety performance evaluations for wireless charging devices.
- Australia: RCM certification mainly covers wireless equipment, electromagnetic compatibility and safety-related requirements.
4.3 Interpreting Certification and Marketing Claims
A Qi certification mark confirms that a product meets interoperability, safety, and baseline efficiency requirements. It does not guarantee top-tier thermal or efficiency performance — it only means the product cleared the minimum bar.
Buyers should also be wary of advertised efficiency numbers. Some manufacturers quote coil-level efficiency rather than full-system efficiency, which makes the product look better on paper than it performs in real use. Independent third-party test data almost always provides a more realistic picture.
5. Complete Standard Lab Testing Procedure
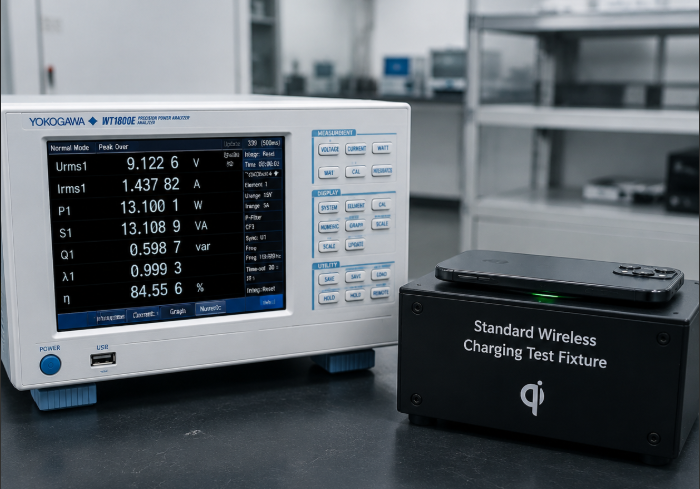
Professional efficiency testing follows a strict, repeatable workflow to ensure results are consistent and comparable across different products.
5.1 Test Environment and Equipment
Reliable testing starts with a controlled setup.
- Test environment: Maintain stable laboratory conditions to avoid temperature and humidity fluctuations that could skew test results. The test space is free of forced airflow, nearby metal objects, and external electromagnetic interference.
- Core equipment: A high-precision power analyzer measures input and output power simultaneously. A programmable AC power supply simulates different global grid voltages. A standard reference receiver and programmable electronic load remove device-to-device variation. A precision positioning fixture controls coil alignment and distance. A thermal imaging camera captures surface heat distribution.
- Sample preparation: Test units are left in the controlled environment long enough to reach thermal and electrical equilibrium before testing begins.
5.2 Baseline Efficiency Testing
First, engineers run tests under ideal conditions. The coils are perfectly aligned at a standard separation distance, and the system runs at full rated load. Testing continues from a cold start until thermal equilibrium is reached, recording both peak cold-start efficiency and steady-state hot efficiency. Engineers also test across a range of load levels from light to full to build an efficiency-versus-load curve and identify the most efficient operating point.
5.3 Misalignment and Offset Testing
Perfect alignment is rare in real life, so testers systematically move the receiver to measure how quickly efficiency drops off. They test horizontal offset at set intervals, increasing vertical distance to simulate thicker phone cases, and angular tilt to simulate casual placement. This reveals the charger’s real-world fault tolerance, not just its best-case performance.
5.4 Extreme Condition Testing
To stress-test the design, labs run additional scenarios:
- High ambient temperature testing at elevated temperatures to measure thermal efficiency drop and thermal throttling behavior.
- Protective case testing with case materials of different thicknesses and compositions.
- Foreign object testing with standard metal test samples to observe efficiency changes and safety protection response.
5.5 Long-Term Stability Testing
Finally, the charger runs at full load for an extended period. Testers monitor how efficiency drifts as internal temperatures climb, and record whether thermal throttling engages and how much power and efficiency drop afterward. This test reflects the experience of long charging sessions better than a short peak-efficiency snapshot.
6. Core Factors That Shape Wireless Charging Efficiency
A long list of design and environmental factors influence how efficiently a wireless charger operates in daily use.
6.1 Coil Alignment Accuracy
Magnetic coupling strength depends almost entirely on how well the two coils line up. Even slight misalignment can cause a noticeable drop in efficiency, and severe misalignment may reduce efficiency drastically. This is why magnetic alignment systems like Qi2 and MagSafe improve real-world average efficiency so much — they eliminate most human placement error.
6.2 Transmission Distance and Material Interference
Wireless charging works best over very short distances. Thicker protective cases or accessories with metal components can increase transmission distance and reduce magnetic coupling efficiency. Metal objects like keys or coins placed between the coils create eddy current heating, waste energy, and trigger safety protection systems.
6.3 Charging Protocol and Power Level
Basic 5W Qi charging generally operates at lower efficiency levels. The 15W extended power profile can achieve higher efficiency through improved coil design and frequency tuning. Proprietary high-speed protocols often push power higher, but they face a harder tradeoff between efficiency and heat, and their real-world average efficiency is not always better than standard protocols.
6.4 Hardware Design and Component Quality
Component quality makes a measurable difference. Litz wire coils, for example, suffer less high-frequency loss than simple enameled wire coils, and higher quality factor (Q) coils transfer energy more effectively. On the circuit side, synchronous rectification and wide-bandgap semiconductors reduce conversion losses significantly. Even the quality of the power adapter matters — a cheap, noisy adapter can reduce the efficiency of the entire system.
6.5 Ambient Temperature and Cooling
Higher temperatures increase electrical resistance in both coils and semiconductors, which lowers efficiency and generates still more heat in a self-reinforcing cycle. Good thermal design — heat-dissipating materials, vented enclosures, effective heat spreading — breaks this cycle and keeps efficiency stable during long charging sessions.
7. Efficiency Differences Across Charger Types
Not all wireless chargers perform the same. Technology, power level, and form factor all create distinct efficiency profiles.
7.1 By Technology Type
- Standard inductive Qi chargers: Deliver good efficiency when perfectly aligned, but efficiency falls off quickly with misalignment. Real-world average efficiency varies widely based on user placement habits.
- Magnetic Qi2 / MagSafe chargers: Maintain consistent alignment, so their average real-world efficiency is noticeably higher than equivalent non-magnetic models.
- Magnetic resonance chargers: Offer more placement freedom but generally achieve lower peak efficiency.
7.2 By Power Level
Consumer wireless charging system efficiency typically varies based on product design, load level and temperature, with a common range of roughly 60% to 85%.
- 5W–7.5W basic models: Mature technology and widely available.
- 15W standard fast chargers: The current mainstream tier, with well-designed models delivering stronger efficiency performance.
- 25W+ high-power models: Face much greater thermal pressure, and balancing efficiency against heat is the central engineering challenge.
7.3 By Product Form Factor
- Flat desktop pads: Have ambiguous coil positioning, so average real-world efficiency tends to be lower.
- Stand / upright chargers: Hold the phone at a fixed position relative to the coil, so alignment is more consistent and efficiency is usually better than flat pads.
- Car wireless chargers: Suffer from vibration-induced misalignment and high cabin temperatures, so efficiency fluctuates heavily and thermal throttling is common.
- Multi-device charging docks: Multiple coils can create magnetic crosstalk, and single-path efficiency often drops when all devices charge at once.
- Wireless power banks: Add a second battery-to-wireless conversion step, so end-to-end overall efficiency is even lower.
8. Interpreting Test Results and Performance
Efficiency numbers mean very little in isolation. Knowing how to read test results helps you judge whether a charger is well-designed.
8.1 Key Efficiency Metrics Explained
- Peak efficiency: The highest efficiency achieved under perfect conditions. It represents the design’s upper limit but rarely reflects everyday use.
- Steady-state efficiency: Efficiency once the charger reaches thermal equilibrium. This number is much more representative of typical daily charging.
- Weighted average efficiency: The average efficiency across a full charge cycle. This is the best single number for estimating real energy consumption.
- Standby power: Energy wasted when no device is charging. This matters most for chargers left plugged in permanently.
8.2 Industry Efficiency Benchmarks
Under typical test conditions, different charging methods generally show different efficiency ranges, and exact values vary by device design and testing methodology.
- Wired charging: typical efficiency of 85%–95%
- Magnetically aligned wireless charging: typical system efficiency of 70%–80%
- Standard free-placement wireless charging: typical system efficiency of 60%–70%
- Severe misalignment or thick-case scenarios: efficiency drops noticeably from baseline
8.3 Signs of a Well-Designed Efficient Charger
High-quality wireless chargers share consistent traits in test data:
- High peak efficiency, with gentle, gradual efficiency decay as position or load changes.
- No sudden cliff-like efficiency drop after thermal equilibrium, and no frequent on-off thermal throttling.
- Even surface temperature distribution with no isolated, abnormally hot spots.
8.4 The Efficiency and Heat Relationship
Lower efficiency means more input energy is converted into heat, and the exact amount of extra heat depends on the input power level. In turn, higher temperatures increase component resistance and push efficiency down further. Good thermal design is what breaks this negative feedback loop.
9. Real-World Efficiency Test Case Example
Concrete numbers make abstract efficiency concepts easier to grasp. Below is a typical test scenario for a common 15W wireless charger.
9.1 15W Wireless Charger Test Example
In a standard lab test, engineers supply stable input power to the charger and measure output on a standard reference receiver. At perfect alignment and full load, the charger draws roughly 17–19 watts of input power and delivers roughly 11–13 watts of usable output power at the receiver side. Calculating the ratio gives a full-system efficiency in the typical consumer range.
Over 30 minutes of continuous operation, internal and surface temperatures gradually rise. As temperatures climb, efficiency decreases by a small but measurable margin. If temperatures cross the thermal threshold, the charger will gently reduce output power to keep temperatures within safe limits.
9.2 Understanding the Results
Two questions almost always come up when users first see these numbers.
First, why does a “15W” charger not deliver 15W to the phone? The 15W rating describes the maximum power the transmitter can supply to the coil, not the power that reaches the battery. Every conversion step along the way siphons off a little energy as heat, so the final usable power is always lower than the headline rating.
Second, why does efficiency drop as the charger warms up? Electrical resistance in copper coils and semiconductor components rises with temperature. Higher resistance means more energy lost as heat, which means less energy delivered as useful charging power. This is why thermal design is such an important part of efficiency performance.
10. Common Misconceptions About Efficiency Testing
It is easy to draw the wrong conclusions from efficiency numbers. These are the four most frequent mistakes.
- Judging efficiency only by advertised wattage
Many shoppers assume higher wattage automatically means better or faster charging. In reality, a well-built 10W charger can deliver more real-world charging speed than a poorly designed 15W one, because less of its power is wasted as heat. - Only looking at peak efficiency
Peak efficiency numbers look impressive, but they are measured under perfect lab conditions. For daily use, steady-state efficiency and misalignment tolerance matter far more. A charger with slightly lower peak efficiency but very gentle efficiency decay is usually the better real-world choice. - Ignoring efficiency changes after warm-up
Short tests capture cold-start efficiency, but most charging sessions last long enough for the charger to heat up. Efficiency almost always drops a little as temperature rises. Products with poor thermal design can see very large efficiency drops after only 15–20 minutes. - Using on-screen phone power readouts as efficiency data
The charging power number shown on a phone or in a battery app only reflects what the phone’s charging system reports internally. It is not a full-system efficiency measurement, and it does not account for losses in the charging pad, adapter, or magnetic coupling.
11. Practical User Guide: Selection and Optimization
You do not need a lab to choose an efficient charger and get the best performance out of it.
11.1 How to Estimate Efficiency Before Buying
- Prioritize products with official Qi or Qi2 certification, which ensures a baseline level of efficiency and interoperability.
- Refer to independent third-party lab test data for full-system efficiency numbers, rather than relying solely on manufacturer marketing claims.
- Look at thermal design details. Metal bodies, ventilation features, and documented thermal management usually correlate with better sustained efficiency.
11.2 Simple DIY Efficiency Checks
For chargers you already own, you can get a rough sense of efficiency with basic tools:
- USB power meter method: Connect a power meter between the adapter and charging pad to measure input power. Compare it against the device’s reported charging power to estimate approximate efficiency.
- Full-charge energy method: Use a smart plug to record total energy used for a full 0–100% charge, then compare it against the phone battery’s rated capacity.
- Heat feel method: As a very rough rule of thumb, if two chargers charge at a similar rate, the one that runs cooler is almost always the more efficient one.
11.3 Everyday Tips to Improve Efficiency
- Align the phone carefully with the coil center. On magnetic chargers, let the magnet seat properly instead of forcing it into position.
- Remove unusually thick cases or cases with metal inserts, stands, or card holders before charging.
- Place the charger on a hard, well-ventilated surface. Avoid soft fabrics, cushions, or bedding that trap heat.
- Pair the charger with a good-quality power adapter and cable that supports the required power protocol.
11.4 Selection Advice by Use Case
- Desktop daily use: Magnetic upright stand chargers are the best all-around choice — easy to align and consistently efficient over long sessions.
- Car use: Look for models with secure mounting clips and solid thermal design to handle vibration and high cabin temperatures.
- Users in high-electricity-cost regions: Prioritize certified high-efficiency models with low standby power consumption.
- Multi-device households: Choose multi-device docks with independent coils and well-designed power allocation logic.
12. Frequently Asked Questions
1. What is a normal efficiency range for consumer wireless chargers?
Most consumer-grade wireless charging systems fall somewhere between 60% and 85% full-system efficiency, depending on design, alignment, load level and temperature. Well-designed magnetic alignment models usually land on the higher end of that range.
2. Why does wireless charging run hotter than wired charging?
Wireless charging adds an extra magnetic energy conversion step, and the air-gap coupling process produces additional losses. Almost all of that lost energy turns into heat, so even efficient wireless chargers usually run warmer than equivalent wired chargers.
3. Are Qi2 magnetic chargers always more efficient than standard Qi chargers?
Qi2 chargers deliver more consistent real-world efficiency because magnetic alignment removes most placement error. At perfect center alignment, a well-built standard Qi charger can achieve similar peak efficiency, but it will fall off much faster as soon as the phone shifts slightly.
4. How much does a phone case reduce charging efficiency?
It depends heavily on thickness and material. Thin plastic cases usually cause only a small efficiency drop. Thick cases, cases with metal parts, or cases with built-in magnets and card holders can reduce efficiency significantly.
5. Does slightly off-center placement really affect efficiency that much?
Yes, alignment is one of the single biggest factors in real-world efficiency. Even a small shift away from center can cause a measurable drop, and larger misalignment can cut efficiency by a large margin. This is the main advantage of magnetic alignment systems.
6. Do higher-wattage wireless chargers always have higher efficiency?
Not necessarily. Higher power levels generate more heat, which makes efficiency harder to maintain. A well-engineered 15W charger can easily be more efficient than a cheaply built 25W charger.
7. Does high ambient temperature reduce wireless charging efficiency?
Yes. Heat increases electrical resistance in coils and semiconductors, which increases losses and reduces efficiency. Very warm environments can also trigger thermal throttling earlier.
8. Do all Qi-certified chargers have roughly the same efficiency?
No. Qi certification sets a minimum baseline for interoperability and safety, but there is still very wide variation in efficiency and thermal performance between different certified products.
9. Do wireless chargers waste a lot of power on standby?
Modern certified chargers have very low standby power draw, usually a fraction of a watt. It is not zero, but it is small enough that it contributes very little to annual energy cost for most users.
10. Why do two 15W wireless chargers charge at noticeably different speeds?
Headline wattage only tells you the maximum input-side power rating. Actual speed depends on full-system efficiency, thermal throttling behavior, and alignment tolerance. A more efficient charger converts more of that 15W input into usable battery power.
11. Why does my car wireless charger keep cutting in and out? Is that an efficiency problem?
It is often related. Vibration from driving constantly shifts the phone slightly, which changes alignment and efficiency. When efficiency drops too far or heat builds up too quickly, the protection system pauses charging. Poor thermal design makes this worse in hot weather.
12. Can low-efficiency wireless charging damage my phone battery?
The efficiency itself does not directly damage the battery, but the extra heat that comes with low efficiency can accelerate battery aging over time. Modern phones have thermal protection to limit risk, but cooler charging is always gentler on battery health.
13. Is wireless charging efficiency different on 110V vs 230V grids?
There can be small differences because the front-end power adapter operates at slightly different efficiency points at different input voltages. For most well-designed chargers, the difference is small and barely noticeable in daily use.
14. Does charging multiple devices at once lower efficiency on a multi-device dock?
It often does. Total power draw increases, and magnetic crosstalk between adjacent coils can add extra losses. Well-designed docks with good coil isolation minimize this effect, but budget models can see noticeable per-device efficiency drops.
13. Technology Trends
Wireless charging efficiency continues to improve year over year. Several development paths point to better performance ahead.
Future Qi standards are expected to continue raising the efficiency baseline and refining performance requirements for higher power tiers. Wider adoption of wide-bandgap semiconductors will further reduce circuit-side conversion losses. Intelligent control algorithms and dynamic tuning technology will further optimize wireless charging efficiency in the future, automatically adjusting for different positions, loads, and temperatures. Mid-range and multi-device wireless charging technologies are also gradually breaking through efficiency bottlenecks toward more practical everyday use.
Conclusion
Efficiency is the honest metric of wireless charging performance. It tells the real story of how much power makes it from the wall socket into your battery, beneath the marketing wattage numbers and convenience promises. Standardized efficiency testing is the objective tool that cuts through advertising claims and reveals how a product actually performs.
In the end, a great wireless charger is not defined by the biggest wattage number on the box. It is defined by consistent, stable efficiency across real-world conditions — casual placement, thick cases, long charging sessions, warm rooms. Choosing certified products, consulting independent test data, and following simple alignment and cooling best practices will help you get the most out of wireless charging: all the convenience, with less wasted energy and more reliable performance. As the technology matures, wireless charging will keep closing the efficiency gap with wired charging, delivering both freedom and frugality.