
Quick Summary
- Charger efficiency measures how much wall power actually reaches your device, versus being lost as heat. The formula is simple: Efficiency (%) = Output Power ÷ Input Power × 100
- You don’t need a lab to test this. A basic AC watt meter plus a USB-C power meter is enough for home users to get reliable numbers.
- Quality GaN chargers typically hit 90–94% peak efficiency, while older silicon-based chargers usually land between 85–90%. Results always depend on load level, input voltage, and temperature.
- The efficiency curve is not a flat line: it’s lowest at very light load, peaks around 50–75% load, and drops slightly at full load.
- Modern chargers sold in the US and EU must meet DOE Level VI or EU CoC Tier 2 standards, capping no-load power at 0.1W for most models under 49W.
- Higher efficiency means less heat, lower long-term electricity cost, and generally better build quality — but it does not automatically mean faster charging.
1. Why You Should Test Charger Efficiency
1.1 Common Pain Points Every User Has Noticed
Have you ever grabbed two chargers both labeled “65W,” yet one runs warm to the touch while the other stays barely noticeable? Or wondered why a “100W” charger seems to charge your laptop slower than advertised?
You’re not imagining things. The wattage printed on the box tells you maximum output capability — not how efficiently that power is delivered. A poorly designed 65W charger can waste 10 watts or more as heat, like a garden hose spraying water everywhere except where you want it.
1.2 Why Efficiency Matters in Daily Life
Efficiency isn’t just an engineering buzzword. It touches three things you actually care about:
- Heat and safety: Every watt lost becomes heat. Low-efficiency chargers run hotter, stress internal components faster, and raise the temperature of nearby devices.
- Real electricity cost: A single charger wasting 2–3W 24/7 may seem trivial. Multiply it by every adapter in your home, and the annual cost adds up faster than you think.
- Truth in advertising: Some budget brands advertise impressive wattage numbers but cut corners on circuit design. Testing reveals whether you’re getting what you paid for.
1.3 Who This Guide Is For
This article is written for beginner to intermediate tech users in North America and Europe. If you own a USB-C charger and want to know how it actually performs — without an engineering degree — you’re in the right place.
We’ll cover everything from $10 home tools to professional lab methods, explain the standards in plain English, and give you clear benchmarks so you can judge your results like a pro.
2. Core Concepts: How Charger Efficiency Works
2.1 Definition and Formula
At its simplest, charger efficiency is the ratio of useful output power to the power drawn from the wall.
Efficiency (%) = Output Power (W) ÷ Input Power (W) × 100
If a charger pulls 70W from the socket and delivers 63W to your laptop, it’s 90% efficient. The remaining 7W escapes as heat, electromagnetic radiation, and power used by the charger’s own control circuits.
Think of it like a car’s fuel economy: two cars can both go 100 km/h, but one burns 5L per 100km and the other burns 8L. Same speed, very different waste.
2.2 The Four-Stage Power Loss Model
Power doesn’t just vanish inside the charger brick. It gets eaten away at four distinct points along the chain from wall to battery:
- Wall input power (AC) — what your electricity meter bills you for
- Charger output power (DC) — what comes out of the USB-C port (after conversion losses)
- Device input power — what actually enters your phone/laptop (after cable and contact losses)
- Battery storage power — what gets chemically stored (after the device’s internal DC-DC conversion and charging losses)
When people say “charger efficiency,” they almost always mean stage 1 → stage 2: the AC-to-DC conversion inside the brick itself.
2.3 Three Key Measurement Dimensions
Don’t judge a charger by a single number. A complete efficiency picture includes:
- Single-point efficiency: Efficiency at one specific load level (e.g., 65W full load)
- Average efficiency: Average across 25%, 50%, 75%, and 100% load points — this is what DOE and CoC standards use for certification
- Standby / no-load power: How much the charger wastes when plugged in but charging nothing
2.4 Power Factor: Why Volts × Amps ≠ Real Watts
Here’s a detail even many hobbyists miss: on the AC (wall) side, Voltage × Current does not equal real power.
Because chargers are non-linear switching loads, the current waveform lags behind the voltage waveform. The ratio between real power and apparent power is called power factor (PF).
A cheap charger might show 100VA of apparent power but only deliver 70W of real power. A good power meter automatically accounts for this and displays true watts — always use one that does.
2.5 Myth Busting: Higher Efficiency ≠ Faster Charging
This is one of the most common misconceptions.
Charging speed is determined by output power capability and protocol support. A 100W charger charges faster than a 20W charger — regardless of efficiency.
Efficiency determines how much wall power is wasted to achieve that output. A 94% efficient 65W charger doesn’t charge faster than an 86% efficient 65W charger — it just runs cooler and costs less to operate.
2.6 Quick Glossary
| Term | Plain English Meaning |
|---|---|
| Efficiency | How much input power becomes useful output |
| Power Loss | Wasted energy, mostly heat |
| Power Factor | How “cleanly” the charger draws AC power |
| No-load / Standby | Power used when nothing is charging |
| GaN | Gallium Nitride, a semiconductor that cuts switching losses |
| Topology | The internal circuit design of the power supply |
3. Test Equipment Guide: From Budget to Professional
3.1 USB-C Power Meters (Output Side Measurement)
This is the single most useful tool for home users. It plugs inline between charger and device and shows you voltage, current, power, and even PD protocol info.
3.1.1 Entry-Level Basic Power Meters
- What they do: Show V, A, W on the output side
- Price range: $10–$30
- Best for: Casual users who want to verify charging speed
- Limitations: Basic accuracy, may not trigger all PD/PPS profiles properly
3.1.2 Mid-Range PD Protocol Analyzers
- What they do: Full PD 3.0 triggering, PPS support, data logging
- Price range: $40–$80
- Popular models: FNIRSI FNB48S, ChargerLAB Power-Z series
- Best for: Tech enthusiasts, reviewers, anyone doing serious testing
3.1.3 High-Power EPR Meters (240W)
- What they do: Support USB PD 3.1 EPR up to 48V/5A (240W)
- Price range: $60–$120
- Best for: Testing laptop chargers above 100W
- Note: Standard SPR meters max out at 20V/5A = 100W and cannot correctly measure EPR voltages
3.1.4 Key Buying Parameters
When shopping for a USB power meter, check these four things:
- Voltage and current range — must cover what you plan to test
- PD/PPS triggering — lets you force specific voltage levels
- Accuracy rating — look for ±0.5% to ±1% for useful results
- Data logging — useful for capturing curves over time
3.2 AC Wall Watt Meters / Smart Plugs (Input Side)
To calculate efficiency, you also need to measure what the charger draws from the wall.
3.2.1 Function and Use Cases
- Plugs between wall socket and charger
- Displays real watts, voltage, current, and often kWh accumulated
- Essential for measuring standby power and calculating true efficiency
3.2.2 Strengths and Limitations
- Strengths: Cheap, easy to use, works with any device
- Limitations: Most consumer models have ~1–3% accuracy; very low standby power (<0.1W) may be hard to read on budget models
Popular options in Western markets include the Kill A Watt P4460, BN-LINK LCD power meter, and various smart plugs with energy monitoring.
3.3 Professional Lab Equipment
For certification-grade results, labs use dedicated instruments:
3.3.1 Programmable Electronic Load
Simulates a device drawing precise, constant power — far more stable than charging a real phone. This is how you get clean, repeatable efficiency curves.
3.3.2 High-Precision Power Analyzers
Instruments from Yokogawa, Chroma, or Tektronix measure AC input with high accuracy, properly handling power factor and harmonic distortion. Required for official DOE / ENERGY STAR certification.
3.3.3 Programmable AC Source and Thermal Gear
- AC power source: Provides perfectly stable 110V/60Hz or 230V/50Hz regardless of grid conditions
- Thermal camera / thermocouples: Maps temperature distribution across the charger casing
3.4 No-Hardware Option: Software Estimation
If you have no tools at all, some phones and laptops can report rough charging power via software:
- Android: Apps like Ampere, AccuBattery (approximate, device-internal only)
- Windows/Laptops: HWMonitor, PowerShell commands
- macOS: System Report → Power information
Important caveat: Software readings show what reaches the battery or system — not what comes out of the charger. They cannot measure charger efficiency directly, only give a rough sense of charging level.
3.5 Tool Recommendations by User Type
| User Profile | Recommended Setup | Approx. Cost |
|---|---|---|
| Casual user | Basic USB-C power meter + AC watt meter | $25–$50 |
| Tech enthusiast | PD analyzer (Power-Z class) + quality AC meter | $70–$120 |
| Semi-pro reviewer | Above + programmable electronic load | $150–$300 |
| Lab / certification | Power analyzer + programmable AC source + thermal chamber | $5,000+ |
4. Pre-Test Preparation: Ensuring Accurate Results
Bad test conditions produce bad numbers. Follow these controls to get consistent, trustworthy readings.
4.1 Ambient Temperature and Airflow
- Standard room temp: 23°C ± 5°C (per IEC 62301 and most efficiency standards)
- Avoid direct sunlight, heating vents, or enclosed drawers during testing
- Still air is preferred — no fans blowing directly on the unit
4.2 Warm-Up and Thermal Steady-State
A charger’s efficiency changes as it heats up. Cold-start readings are artificially high.
- Rule of thumb: Let the charger run at your target load for 3–5 minutes minimum before recording numbers
- For formal testing: 15 minutes at each load point is the standard practice
4.3 Cable and Connector Requirements
The cable itself eats power. To measure charger efficiency (not cable + charger), use:
- A short, high-quality cable (ideally 0.5m or less)
- A 5A E-Marker cable for anything above 60W
- The same cable every time if you’re comparing multiple chargers
4.4 Load Standardization
If testing with a real phone or laptop:
- Start from the same battery percentage each time (20–40% is ideal for max power)
- Turn off the screen, close background apps, enable airplane mode if possible
- Record data during the constant-power phase before the device starts tapering
4.5 Standardized Test Log Template
For clean comparisons, record every test with:
- Date, ambient temperature
- Charger model and firmware version (if known)
- Input voltage and frequency
- Cable used
- Load level and PD/PPS profile
- Input power, output power, calculated efficiency
- Surface temperature if measured
5. Step-by-Step Efficiency Testing Methods
5.1 Method 1: Dual Power Meter Comparison (Beginner Recommended)
This is the most straightforward home method — measure both ends and divide.
5.1.1 Connection Order
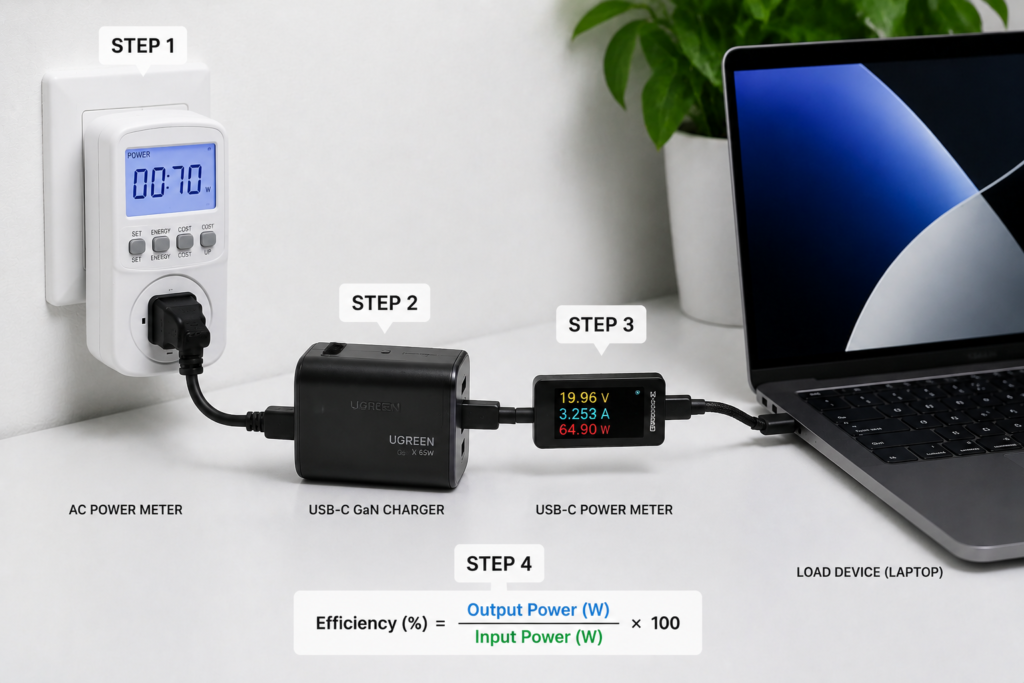
Wall Outlet → AC Watt Meter → Charger → USB-C Power Meter → Load Device
5.1.2 Procedure
- Plug everything in following the chain above
- Set your device to draw a stable charge (low battery, screen off)
- Wait 3–5 minutes for temperatures and readings to settle
- Write down the input watts from the AC meter
- Write down the output watts from the USB meter
- Calculate: Efficiency = Output ÷ Input × 100
- Repeat 2–3 times and average the results
5.1.3 Reading Tips
- Ignore the first 60 seconds — numbers will jump around
- If the power fluctuates, take a 30-second visual average
- Note which PD voltage/current profile is active (e.g., 20V/3.25A = 65W)
5.2 Method 2: Single USB Meter Estimation
If you only have a USB power meter, you can roughly estimate efficiency using typical values, but it’s less accurate.
5.2.1 When to Use This
- Quick comparisons when no AC meter is available
- Relative A/B testing of two chargers with the same setup
5.2.2 Procedure
- Measure output power with your USB meter
- Estimate input power by assuming a typical efficiency (e.g., 88–92% for a quality GaN charger)
- Reverse-calculate: Input ≈ Output ÷ 0.90
5.2.3 Error Warning
This is an estimate, not a measurement. Actual efficiency can vary by ±5% from the assumed value depending on design quality and load level. Never use this method for definitive claims.
5.3 Method 3: Electronic Load Standard Test (Advanced)
For clean efficiency curves, replace the phone/laptop with a programmable electronic load.
5.3.1 Prerequisites
- Programmable DC electronic load
- AC power meter
- USB trigger board or PD-aware load
5.3.2 Multi-Point Test Procedure
- Set the load to 25% of the charger’s rated power
- Wait 15 minutes for thermal stability
- Record input and output power
- Repeat at 50%, 75%, and 100% rated power
- Calculate efficiency at each point
- Compute the four-point average
This four-point average is exactly what DOE Level VI and EU CoC Tier 2 use for certification.
5.3.3 Plotting the Efficiency Curve
Plot load percentage on the X axis and efficiency on the Y axis. You’ll see the classic “hill” shape: low at 25%, peaking around 50–75%, slightly lower at 100%.
5.4 Worked Example: 65W GaN Charger Test
Here’s what a real test might look like:
| Load Level | Output Power | Input Power | Calculated Efficiency |
|---|---|---|---|
| 25% (16.25W) | 16.3 W | 19.1 W | 85.3% |
| 50% (32.5W) | 32.6 W | 35.5 W | 91.8% |
| 75% (48.75W) | 48.8 W | 52.4 W | 93.1% |
| 100% (65W) | 65.1 W | 70.8 W | 92.0% |
| Average | — | — | 90.6% |
Verdict: This is a solid performer. It comfortably exceeds the DOE Level VI requirement of 88% average for 49–250W class chargers.
5.5 Quick 5-Step Sanity Check
If you just want a fast answer without the full procedure:
- Plug AC meter into wall
- Plug charger into AC meter
- Plug USB meter + phone into charger
- Wait 3 minutes
- Divide output watts by input watts
You won’t get certification-grade data, but you’ll know within ~2% whether your charger is decent or a wasteful brick.
6. Testing Different Charger Types and Scenarios
6.1 USB-C PD / PPS Fast Chargers
- PD fixed PDOs: Test at each fixed voltage (5V, 9V, 15V, 20V). Higher voltage levels usually show better efficiency because current is lower.
- PPS APDOs: Programmable Power Supply lets the device request fine voltage steps. Efficiency in PPS mode is typically similar to nearby fixed PD levels.
- Tip: A good PD analyzer can force specific PDOs so you don’t depend on the device’s charging algorithm.
6.2 GaN Chargers: What to Expect
Gallium Nitride chargers are famous for high efficiency and small size — but not all GaN is created equal.
- Well-designed 65W GaN: 90–93% average efficiency is typical
- Premium 100W+ GaN with ACF/LLC: Can reach 93–95% peak
- Budget “GaN” brands: Some cut corners elsewhere; don’t assume the GaN label alone guarantees 90%+
The efficiency advantage comes from lower switching losses and the ability to run at higher frequencies — which also shrinks the transformer. Think of it as upgrading from an old incandescent bulb to LED: same light, less heat.
6.3 Multi-Port Chargers
Multi-port chargers have a special consideration: efficiency changes depending on how many ports are active.
- Single-port full load: Usually the most efficient operating mode
- Multi-port simultaneous load: Total efficiency may drop 1–3% due to power sharing circuits
- Idle ports: Each active port adds a small overhead loss
Always test both single-port max and your typical real-world multi-port usage pattern.
6.4 Wireless Charging System Efficiency
Wireless charging is a whole different animal. When people say “wireless charger efficiency,” they usually mean system efficiency — wall plug to battery — which includes:
- Transmitter conversion loss
- Coupling loss (the big one — energy lost across the air gap)
- Receiver conversion loss
- Phone battery charging loss
Typical system efficiency for Qi wireless charging ranges from 50% to 70%, depending on alignment, coil size, and distance. The charger brick alone is just as efficient as any other — the air gap is where most energy vanishes.
6.5 Cross-Grid Voltage Compatibility
Most modern chargers work on 100–240V worldwide, but efficiency isn’t identical across the range.
- 110–120V grids (US, Japan): Higher current for the same power → slightly higher conduction losses → efficiency typically 1–3% lower
- 220–240V grids (EU, Asia): Lower current → slightly better efficiency
If you travel between regions, test at both voltages if you can — or at least understand that your US results may be slightly worse than the manufacturer’s 230V datasheet numbers.
7. How Design and Technology Shape Efficiency
7.1 Switching Topologies and Their Efficiency Tradeoffs
The “circuit blueprint” inside a charger is called its topology. It’s the single biggest design decision affecting efficiency.
7.1.1 Basic Flyback
- The cheapest and most common topology for low-power chargers
- Simple, low component count
- Efficiency ceiling: roughly 88–90% at best
- Found in budget 5–20W chargers
7.1.2 Quasi-Resonant (QR) Flyback
- Adds resonant switching to reduce turn-on losses
- The workhorse of mid-range 25–65W chargers
- Typical efficiency: 89–92%
- Better than basic flyback, but not state of the art
7.1.3 Active Clamp Flyback (ACF)
- Adds an active clamp circuit to recycle leakage energy
- The dominant topology in modern 30–140W GaN chargers
- Typical efficiency: 92–94%
- Enables smaller size and cooler operation
7.1.4 LLC Resonant Topology
- The efficiency king for higher power levels
- Soft switching on both primary and secondary sides
- Typical efficiency: 94–96%+ at medium-to-full load
- Most common in 100W+ chargers, gaming laptops, and all-in-ones
7.2 Semiconductor Materials
7.2.1 Silicon MOSFET Limits
Silicon has served us for decades, but it’s approaching its physical limits. At high switching frequencies, switching losses balloon. To keep efficiency up, designers must run slower — which means bigger, heavier magnetics.
7.2.2 Why GaN Improves Efficiency
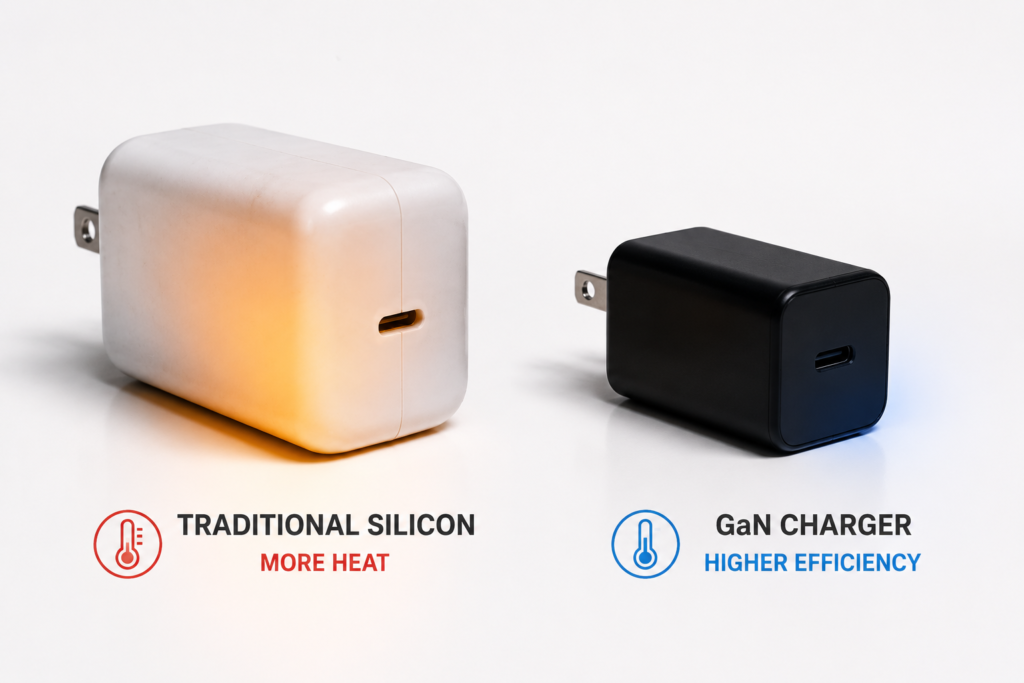
Gallium Nitride is a wide-bandgap material with three key advantages:
- Much faster switching — less energy lost during each on/off transition
- Lower on-resistance for a given die size — less conduction loss
- Higher temperature tolerance — runs reliably hotter
In consumer chargers, GaN typically delivers a 3–7% efficiency boost over equivalent silicon designs, or alternatively, the same efficiency in a 30–50% smaller package.
7.2.3 SiC: For Higher Power
Silicon Carbide is even more capable but also more expensive. It’s rare in phone/laptop chargers today but common in industrial power supplies and EV on-board chargers.
7.3 Rectification and Magnetics
7.3.1 Synchronous Rectification vs. Diode Rectification
On the output side, diodes have a fixed voltage drop that wastes power. Replacing them with MOSFETs (synchronous rectification) recovers 2–5% efficiency. Every modern quality charger uses this — if yours doesn’t, it’s old design.
7.3.2 Planar vs. Wire-Wound Transformers
Planar transformers use flat copper sheets instead of round wire. They handle higher frequency better, waste less energy, and run cooler. They’re also more expensive and common in premium GaN chargers.
7.4 The Efficiency Curve: Why It’s Not Flat
Every charger has a “sweet spot.” Understanding why will make you a smarter tester.
7.4.1 Light Load: Why Efficiency Drops
At very low power (under 25% load), the charger’s control circuits and standby bias consume a relatively large fraction of total power. Imagine driving a truck at 10 km/h — the engine’s overhead dominates, and fuel economy is terrible.
7.4.2 Medium Load: The Efficiency Peak
Around 50–75% load, switching and conduction losses are balanced, and overhead is a small fraction of total power. This is where almost all chargers post their best numbers.
7.4.3 Full Load: Slight Decline
At 100% rated power, conduction losses and heat rise. Components get hotter, resistance increases, and efficiency typically dips 1–2% from the peak. Some chargers also hit thermal limits and gently reduce power.
7.5 External Factors
7.5.1 Input Voltage
As noted earlier: higher line voltage = lower current = lower I²R losses. A 230V test will almost always show 1–3% better efficiency than 110V on the same charger.
7.5.2 Temperature and Cooling
Heat raises semiconductor resistance and increases core losses in magnetics. A charger tested in a 35°C room will measure less efficient than one tested at 20°C. Good thermal design (heat pads, venting, copper pours) keeps efficiency high even under load.
7.5.3 Cable Loss
The cable is technically outside the charger, but users often blame the charger. A long, thin cable can drop 1–3W at 65W — enough to make a good charger look mediocre. Always test with a known-good short cable.
8. Why Your Measured Efficiency Is Lower Than Expected
You tested your shiny new charger and got 84% when reviews said 91%. Before you declare it fake, work through this checklist.
8.1 Inherent Losses in the Test Chain
8.1.1 Charger Internal Conversion
This is the real efficiency we’re trying to measure. If it’s genuinely low, the charger is poorly designed.
8.1.2 Cable and Connector Loss
A 1m 3A cable at 65W can easily drop 1–2W. Your USB meter measures after the cable, so it looks like the charger is less efficient than it really is.
Fix: Test with the shortest, thickest cable you have.
8.1.3 Device-Side Conversion Loss
If you’re testing with a phone, the phone’s internal charging circuit further reduces power reaching the battery. This is not the charger’s fault.
Fix: To measure charger-only efficiency, use an electronic load — not a phone battery percentage.
8.2 Test Procedure Errors
8.2.1 Reading Too Early (Cold Start)
Efficiency readings are highest when the charger is cold. They drift down 1–2% as it warms up.
Fix: Wait 3–5 minutes minimum; 15 for formal testing.
8.2.2 Meter Accuracy and Calibration
Cheap meters have ±2–3% error. Two $10 meters can disagree by 5% on the same signal.
Fix: Use reputable meters. For comparisons, always use the same two meters.
8.2.3 Wrong Cable Choice
Using a 3A cable on a 100W charger throttles current to 60W max — you’ll never see full power, and efficiency at that reduced level may be different.
Fix: Match cable rating to charger power.
8.3 Charger-Side Power Limiting
8.3.1 Thermal Throttling
If the charger gets too hot, it reduces output power to protect itself. You’ll see output watts gradually drop.
Fix: Ensure proper airflow; test at room temperature. If it still throttles, the thermal design is inadequate.
8.3.2 Burst Mode at Light Load
At very low power, many chargers enter burst-mode operation to save standby power. This causes power readings to flicker and can confuse basic meters.
8.3.3 Input Voltage Fluctuation
If your wall voltage drifts 5–10%, input power readings shift. Grid voltage can vary significantly by location and time of day.
8.4 Protocol and Compatibility Issues
8.4.1 Protocol Mismatch
If your device doesn’t support the charger’s fast-charge protocol, it falls back to 5V or slow charging. You’re not testing the charger at its rated power.
8.4.2 Cable Current Limiting
A cable without E-Marker chip caps out at 3A (60W at 20V). The charger and device may both support 5A, but the cable acts as a bottleneck.
9. Interpreting Results: What Counts as Good?
9.1 Efficiency Rating Reference
Use this table as a rough benchmark for typical USB-C chargers at or near 65W:
| Efficiency | Rating | What It Means |
|---|---|---|
| ≥ 93% | Excellent | Premium GaN with ACF/LLC topology. Cool running, top-tier design. |
| 90–93% | Very Good | Solid modern GaN or high-end silicon. Meets and exceeds all regulatory standards. |
| 87–90% | Good | Decent QR flyback, mainstream quality. Fully compliant with DOE VI. |
| 83–87% | Fair | Older or budget design. Works, but runs warmer and wastes more power. |
| < 83% | Poor | Likely cheap no-name unit, obsolete design, or faulty. Consider replacing. |
Note: Exact numbers shift with power level. Higher-wattage chargers (100W+) can achieve higher peak efficiency; tiny 20W chargers rarely exceed 90%.
9.2 The Efficiency Curve Tells More Than a Single Number
A charger that advertises “94% efficiency” might be telling the truth — but only at one specific 65% load point. At 25% load it could be 82%, and at 100% it could be 89%.
The four-point average is the number you should care about. It matches real-world mixed usage far better than a marketing peak number.
9.3 Standard Efficiency Curve Shape
Every decent charger follows this pattern:
- Light load ramp-up: Efficiency climbs quickly from low values as load increases
- Mid-load plateau: Broad peak from ~40% to ~80% load
- Full-load gentle decline: 1–3% drop from peak at 100% rated power
If your curve looks wildly different — for example, efficiency plummeting above 70% load — something may be wrong with the charger’s thermal design or component quality.
9.4 Standby Power: What’s Acceptable
| No-Load Power | Rating | Standard Reference |
|---|---|---|
| < 0.075W | Excellent | Beats CoC Tier 2 for <49W |
| 0.075–0.10W | Good | Meets DOE Level VI for <49W |
| 0.10–0.21W | Acceptable | Typical for 49–250W class |
| > 0.3W | High | Older design or cheap unit |
For chargers under 49W, DOE Level VI requires ≤ 0.1W no-load power. EU CoC Tier 2 is even stricter at ≤ 0.075W for the same class.
9.4 Troubleshooting Bad Results
If efficiency is way lower than expected:
- Check the cable — swap in a known-good 5A E-Marker cable
- Check the protocol — confirm full PD voltage is negotiated, not 5V fallback
- Check temperature — is the charger throttling?
- Check meter accuracy — verify against a known reference if possible
- Check load level — you might be testing in the inefficient light-load zone
10. Common Mistakes and Safety Rules
10.1 Most Frequent Testing Mistakes
Mistake 1: Using phone battery percentage to calculate efficiency
The phone’s internal charging IC, battery chemistry, and system power draw all introduce losses. You can’t derive charger efficiency from screen-on “charging speed.”
Mistake 2: Testing at only one load point
A single number at full load tells you almost nothing about real-world average efficiency. At minimum, test light, medium, and full load.
Mistake 3: Ignoring power factor
Multiplying wall volts × wall amps gives apparent power (VA), not real power (W). Always use a meter that displays true watts.
Mistake 4: Reading cold-start numbers
Efficiency drifts down as the charger warms. Record only after thermal stabilization.
Mistake 5: Confusing charger efficiency with system efficiency
Wireless charging, cable loss, and phone internal conversion are separate losses. “Charger efficiency” specifically means AC-in to DC-out of the brick.
10.2 Safety Rules for Testing
- AC side caution: Never modify or probe live AC wiring. Plug-in watt meters are designed for safe user access — use them.
- Don’t overload: Running a charger significantly above its rated power for extended periods is dangerous.
- Stop if it smells funny: Burning plastic or unusual odors mean stop immediately.
- Watch surface temperature: If the casing exceeds 70°C (too hot to hold), the charger may be defective or badly designed.
- Use proper cables: Damaged or undersized cables overheat and are a fire risk.
11. Frequently Asked Questions
Q1: What’s considered a good charger efficiency?
For a modern 65W USB-C PD charger, 90%+ average efficiency is good, and 92%+ is excellent. Budget chargers typically range from 84–89%. The legal minimum in the US (DOE Level VI) is 88% average for the 49–250W class.
Q2: Do I need expensive equipment to test at home?
No. A basic AC watt meter ($15–25) and a USB-C power meter ($15–30) will give you perfectly useful results. You won’t get certification-grade precision, but you’ll easily tell the difference between a good charger and a terrible one.
Q3: Are GaN chargers always more efficient than silicon?
Not automatically. GaN is a material advantage, but a poorly designed GaN charger can be less efficient than a well-executed silicon one. Topology, component quality, and thermal design matter just as much. That said, most quality GaN chargers do outperform most quality silicon chargers by 3–7% in the same power class.
Q4: Why do different reviewers get different efficiency numbers for the same charger?
Three main reasons:
- Different input voltage: 110V vs 230V changes results by 1–3%
- Different ambient temperature: Hotter rooms = lower efficiency
- Different test equipment and methods: Meters have varying accuracy; some test 4 points, some test 1
As long as methods are consistent within one review, comparisons are valid.
Q5: Is fast charging less efficient than slow charging?
Not necessarily. The charger itself is usually most efficient at 50–75% load, which for a high-wattage charger is fast-charging territory. However, faster charging generates more heat in the phone battery, which affects battery-level efficiency — that’s a device-side issue, not a charger efficiency issue.
Q6: Do chargers lose efficiency as they age?
Gradually, yes. Electrolytic capacitors dry out over years, MOSFETs degrade slightly, and solder joints can develop resistance. The drop is usually 1–3% over 5+ years. Heat accelerates aging — a charger that runs hot will degrade faster.
Q7: Does using multiple ports at once lower total efficiency?
Usually slightly, by 1–3 percentage points. Power-sharing circuits add a small overhead, and higher total current increases internal losses. The difference is small enough that most users won’t notice on their electricity bill.
Q8: How can I tell efficiency from the spec sheet?
Most consumer chargers don’t print efficiency on the box. Look for:
- DOE Level VI or CoC Tier 2 markings — they guarantee a minimum baseline
- Mention of GaN, Active Clamp Flyback, or LLC topology (marketing copy often highlights these)
- Energy Star certification
If none are listed, assume average-to-mediocre efficiency.
Q9: Does a 100W charger always draw 100W from the wall?
No. The wattage rating is maximum output capability. If your phone only draws 18W, the charger pulls roughly 20W from the wall (plus losses). Think of it like a 100W speaker — it doesn’t blast 100W all the time, it just can.
Q10: How efficient is wireless charging?
The full system (wall to battery) is typically 50–70% — noticeably worse than wired. The charger brick itself is normal efficiency; most loss happens across the magnetic coupling gap between transmitter and receiver coils.
12. Summary and Recommendations
12.1 Key Takeaways
- Charger efficiency measures AC-to-DC conversion quality. It’s calculated as output power divided by input power.
- You can test at home with two inexpensive tools: an AC watt meter and a USB-C power meter.
- Efficiency follows a curve: lowest at light load, highest at 50–75% load, slightly lower at full load. The four-point average is the most meaningful number.
- Quality GaN chargers generally deliver 90–94% efficiency; older silicon designs typically 85–90%.
- Standards like DOE Level VI and EU CoC Tier 2 set minimum efficiency and maximum standby power for products sold in those markets.
- Efficiency affects heat, electricity cost, and component longevity — but not raw charging speed.
12.2 Recommended Setup by User Type
- Casual user: Grab a basic USB-C power meter. It won’t give full efficiency numbers, but you’ll verify real charging speed and spot obvious fakes.
- Hobbyist / tech reviewer: Add an AC watt meter and a quality PD analyzer. This is the sweet spot for useful, trustworthy testing.
- Serious testing: Add a programmable electronic load. This eliminates device-side variables and produces clean, repeatable efficiency curves.
12.3 Final Principles
- Test at multiple load points — one number tells you very little
- Control your environment — temperature, cable, and input voltage matter
- Compare apples to apples — same tools, same conditions, same power class
- Prioritize average efficiency over marketing peak numbers
- If a charger runs uncomfortably hot, it’s probably inefficient — trust your hand as a first-pass detector
Testing charger efficiency is one of the most practical ways to cut through marketing hype and understand what you’re really plugging into your wall. With $30 worth of tools and 15 minutes of time, you can separate the keepers from the energy-wasting bricks.