
Ever picked up a 100W USB-C charger, only to notice your phone or laptop charges far slower than advertised? You’re not alone. The wattage printed on a charger label tells you its maximum rated output — not how much power actually reaches your device’s battery.
In this guide, we’ll break down exactly how to measure real charging power, what tools you need, why results often fall short of advertised specs, and how to tell if your charger, cable, and device are working as they should. Whether you’re troubleshooting slow charging, verifying a new purchase, or just curious about how your tech works, this guide is built for regular users with no advanced engineering background.
1. Charging Power Fundamentals: What You’re Actually Measuring
Before you grab a tester, it helps to understand the basics of how power moves from your wall socket to your battery.
1.1 The Core Formula: Power = Voltage × Current
Electrical power is calculated with a simple rule:
Power (Watts, W) = Voltage (Volts, V) × Current (Amps, A)
For example:
- 5V × 2A = 10W (basic slow charging)
- 9V × 2.22A = 20W (standard phone fast charging)
- 20V × 3.25A = 65W (standard laptop charging)
- 20V × 5A = 100W (high-power laptop charging)
Unlike old fixed-voltage chargers, modern USB PD chargers dynamically adjust voltage and current during a charge session. The final wattage is negotiated between the charger, cable, and device — not set by the charger alone.
1.2 The 4-Stage Power Model: From Wall Socket to Battery
A common mistake is assuming the charger’s output equals the power your battery receives. In reality, power loses energy at every step of the chain:
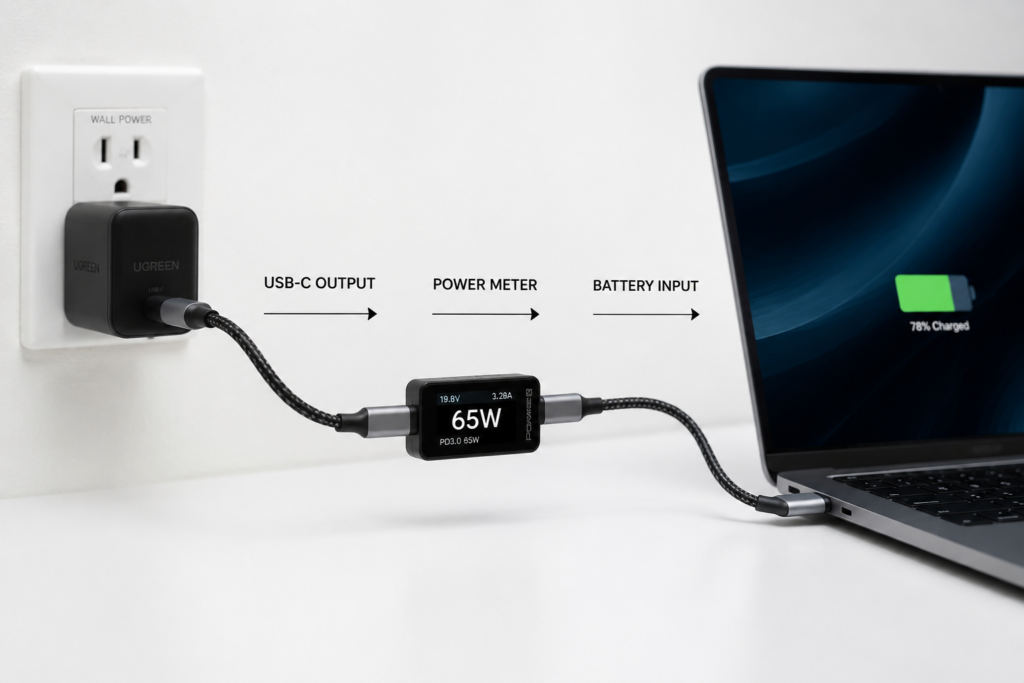
- Input Power Total power drawn from the wall outlet. This includes all waste heat from the charger’s internal components.
- Charger Output Power Power sent out through the USB-C port. This is what most USB power meters measure. Quality chargers typically convert 80–95% of input power to usable output power.Infineon T…
- Device Input Power Power that actually enters your phone or laptop. Some energy is lost as heat in the cable and connector contacts.
- Battery Storage Power The energy that actually gets stored in your battery. The device’s internal charging circuit and battery chemistry add another layer of loss.
This is why a “100W charger” will never put 100W directly into your battery — losses are normal and expected.
1.3 Three Key Power Metrics to Track
Don’t just glance at a single number. A full charge cycle has three important values:
- Peak Power: The highest wattage reached briefly after plugging in. Great for verifying maximum capability.
- Sustained Power: The stable wattage maintained for minutes at a time. This is the number that actually determines charging speed.
- Average Power: Total energy delivered divided by total charge time. Useful for comparing real-world performance across chargers.
1.4 Quick Glossary
- USB PD (USB Power Delivery): The official universal fast-charging standard for USB-C.
- PDO (Power Data Object): A data message that tells a device what voltage/current levels a charger supports.
- E-Marker: A tiny chip inside high-power USB-C cables that tells the system the cable can safely carry more current.
- SPR (Standard Power Range): The standard USB PD power range up to 100W at 20V.
- EPR (Extended Power Range): The high-power extension of USB PD 3.1, supporting up to 240W at 48V.
2. Tools for Measuring USB-C Charging Power (From Beginner to Pro)
You don’t need a lab to get accurate results. Here are the most useful tools, ordered by cost and complexity.
2.1 USB-C Power Meters (Recommended for Most Users)
A USB-C power meter is a small passthrough device that sits between your charger and cable. It shows real-time voltage, current, wattage, and often the active charging protocol.
Entry-Level Basic Power Meters
- What they do: Display V, A, and W in real time.
- Best for: Phones, tablets, and 60–100W laptop chargers.
- What to look for: USB-C input/output, PD 3.0 support, and 0.1W resolution.
Mid-Tier PD Protocol Analyzers
- What they do: Everything a basic meter does, plus read PDO lists, detect PPS, and show E-Marker cable info.
- Best for: Troubleshooting why fast charging isn’t working, testing cable quality.
- What to look for: PPS support, E-Marker reading, and a recording/logger function.
High-Power EPR-Certified Testers
- What they do: Safely measure 28V/36V/48V EPR systems up to 240W.
- Best for: Gaming laptops, 140W+ chargers, and PD 3.1 equipment.
- Important: Regular 100W meters may not read or safely handle EPR voltages.
Key Buying Criteria
- Maximum voltage/current rating
- Supported protocols (PD 3.0, PPS, QC)
- Measurement accuracy
- Passthrough design (it should not block PD communication)
2.2 Wall Outlet Power Meters / Smart Plugs
These plug directly into your wall socket, and you plug the charger into them. They measure total AC power drawn from the grid.
- Pros: Zero setup, works with any plug-in charger, also tracks total energy (kWh).
- Cons: Only shows wall-side input power — you have to estimate output power using efficiency. You can’t see protocol details or cable losses.
2.3 Multimeters & Professional Lab Gear
Digital Multimeters
- How they work: You measure voltage across the lines and current in series, then calculate wattage manually.
- Best for: Users with basic electronics knowledge who need maximum flexibility.
- Warning: Improper use can short out your charger or device. Always work on the low-voltage DC side only.
Electronic Loads & Power Analyzers
- What they do: Simulate a device drawing power and draw precise performance curves.
- Best for: Reviewers, engineers, and anyone testing charger maximum limits.
- Not needed for: Regular home users.
2.4 Software-Only Estimation (No Hardware)
If you have no tools, you can get a rough estimate from system software:
- Android: Apps like AccuBattery or Ampere estimate charging current.
- Windows: Tools like HWiNFO show battery charge rate.
- macOS: Check System Information → Power for AC adapter details.
Important: Software readings come from the device’s internal sensors and system APIs. They are helpful for comparison but far less accurate than a hardware meter.
2.5 Tool Recommendation by User Type
| User Type | Recommended Tool | Budget Range |
|---|---|---|
| Casual phone/tablet user | Basic USB-C power meter | $10–$25 |
| Laptop owner / tech enthusiast | PD protocol analyzer | $30–$80 |
| 140W+ / EPR laptop user | EPR-capable power meter | $50–$120 |
| Reviewer / hardware tester | Electronic load + power analyzer | $150+ |
3. Before You Test: How to Get Accurate, Consistent Results
Charging power changes constantly. If you test under different conditions, you’ll get different numbers — and bad comparisons. Follow these controls for reliable measurements.
3.1 Control Battery Level
Always test at the same battery state:
- For peak/sustained power: Test between 20% and 50% charge. This is where devices usually run at full speed.
- Avoid testing above 80%: Most devices slow charging dramatically near full to protect the battery.
3.2 Control Temperature
Heat is the biggest enemy of fast charging.
- Test at room temperature (around 20–25°C / 68–77°F).
- Remove thick phone or laptop cases during testing.
- Don’t test right after heavy gaming or video rendering.
3.3 Use the Right Cable
- For 60W+: Use a cable rated for the power you expect to measure.
- For 100W+: You must use a 5A E-Marker cable.
- For 240W EPR: You need an official EPR-rated cable. A bad cable is the #1 cause of “why is my charger so slow?” complaints.
3.4 Minimize System Load
- On phones: Turn the screen off, close background apps, or use airplane mode.
- On laptops: Test at idle first. High CPU/GPU load will divert power away from the battery.
3.5 Standardized Test Log Template
Record your results consistently. Here’s a simple template:
| Time (min) | Battery Level | Voltage (V) | Current (A) | Power (W) | Protocol | Device Temp |
|---|---|---|---|---|---|---|
| 0:00 | 30% | 19.9 | 3.18 | 63.3 | PD Fixed | 31°C |
| 2:00 | 34% | 19.8 | 3.10 | 61.4 | PD Fixed | 33°C |
| 5:00 | 40% | 19.7 | 2.75 | 54.2 | PD Fixed | 35°C |
4. Step-by-Step Testing Methods
4.1 Method 1: USB Power Meter Direct Measurement (Most Accurate)
This is the gold standard for most users.
Connection Order
Wall Outlet → Charger → USB Power Meter → USB-C Cable → Device
Steps
- Plug the charger into wall power.
- Plug the power meter into the charger’s USB-C port.
- Plug your charging cable into the output side of the meter.
- Connect the cable to your device.
- Wait 30–120 seconds for the PD handshake to complete and readings to stabilize.
- Record peak power (first 30 seconds) and sustained power (2–5 minute mark).
- Note the displayed protocol (PD, PPS, QC, etc.).
Pro tip: If the voltage stays stuck at 5V, the PD handshake failed. Try a different cable or clean the USB-C ports.
4.2 Method 2: Wall Plug / Smart Plug Indirect Measurement
Use this if you can’t insert a meter into the USB chain.
Steps
- Plug your smart power meter into the wall.
- Plug the charger into the meter.
- Note the no-load (idle) power first — usually 0.3–1W.
- Connect your device and wait for power to stabilize.
- Subtract idle power from the reading.
- Estimate output power: Estimated USB Output Power ≈ (Wall Power − Idle Power) × 0.85 to 0.90
The 0.85–0.90 multiplier accounts for typical charger conversion efficiency. This method gives a rough estimate, not a precise number.
4.3 Method 3: Multimeter DC Measurement (Advanced)
Only attempt this if you have basic electronics experience.
Safety First
- Never open the AC side of a charger. Capacitors can hold dangerous charge even when unplugged.
- Only measure on the low-voltage USB-C output side.
Steps
- Set the multimeter to DC voltage mode.
- Measure voltage across the VBUS and GND pins at the device end of the cable.
- Switch to DC current mode (use the 10A terminal if available).
- Wire the meter in series with the positive line.
- Multiply voltage × current to get power.
- Account for meter burden voltage and contact resistance for best accuracy.
4.4 Real-World Example: 65W PD Charger Test
Here’s what a normal, healthy 65W charger looks like in practice:
- Advertised: 65W (20V × 3.25A)
- Measured sustained output: 19.8V × 3.10A = 61.4W
- Result: ~94% of rated power. This is completely normal and expected.
If you see 45W or less from a 65W charger, something is limiting performance — usually the cable, protocol mismatch, or device battery level.
4.5 Quick 5-Step Test Routine
- Plug in the power meter.
- Confirm PD protocol is active (not stuck at 5V).
- Wait 30 seconds for readings to settle.
- Write down V, A, and W.
- Compare to your device’s maximum supported power.
5. Testing Different Devices & Scenarios
5.1 Phones & Tablets
- Best test window: 20–50% battery, screen off.
- What to watch for: PPS dynamic voltage adjustment, temperature-based throttling.
- Normal behavior: Peak power may only last 30 seconds to a few minutes before thermal limits kick in.
5.2 USB-C Laptops
- Power range: 45W, 65W, 90W, 100W, 140W, and up to 240W for gaming models.
- Key rules:
- 60W+ requires a 5A E-Marker cable.
- 100W+ EPR systems need EPR-rated cables and chargers.
- Power drops sharply under heavy CPU/GPU load, as power goes to the system instead of the battery.
5.3 Wireless Charging (Qi / MagSafe)
- Challenge: You can’t insert a meter between the coil and the phone.
- Method 1: Measure the wall input power of the wireless pad, then estimate efficiency (typically 50–75%).
- Method 2: Use a specialized wireless power test receiver (for advanced users).
- Expect losses: A 15W wireless charger will rarely deliver more than 8–10W to the battery.
5.4 Power Banks
- Input test: Measure the power going into the power bank while recharging it.
- Output test: Measure the power coming out when it charges your phone.
- Efficiency check: Divide total output energy by total input energy. Good power banks hit 85%+ efficiency.
5.5 Multi-Port Chargers
- Multi-port chargers share total power across ports.
- To test a single port’s maximum output, leave all other ports empty.
- To test real-world shared behavior, plug devices into other ports and watch power drop on your test port.
6. How USB PD Protocols & Cables Shape Your Power Numbers
The charger doesn’t decide the power on its own — everything is negotiated. Here’s how it works.
6.1 USB PD Protocol Layers
USB PD operates in two main ranges, defined by the USB-IF standard:USB-IF
SPR (Standard Power Range) — Up to 100W
This is the standard range used by most phones and laptops.
- Fixed PDO: Pre-set voltage levels (5V, 9V, 15V, 20V). The device picks the closest match.
- PPS (Programmable Power Supply): A flexible mode where voltage adjusts in tiny 20mV steps. This lets phones charge more efficiently and run cooler.
EPR (Extended Power Range) — 100W to 240W
Added in USB PD 3.1, EPR adds higher fixed voltages: 28V, 36V, and 48V at up to 5A.
- AVS (Adjustable Voltage Supply): The EPR equivalent of PPS, with smooth voltage adjustment for high-power devices.
How negotiation works: The charger broadcasts its capabilities. The device requests a voltage/current it’s comfortable with. If the cable can handle it, a “PD contract” is formed and charging begins.
6.2 USB-C Cable Power Limits
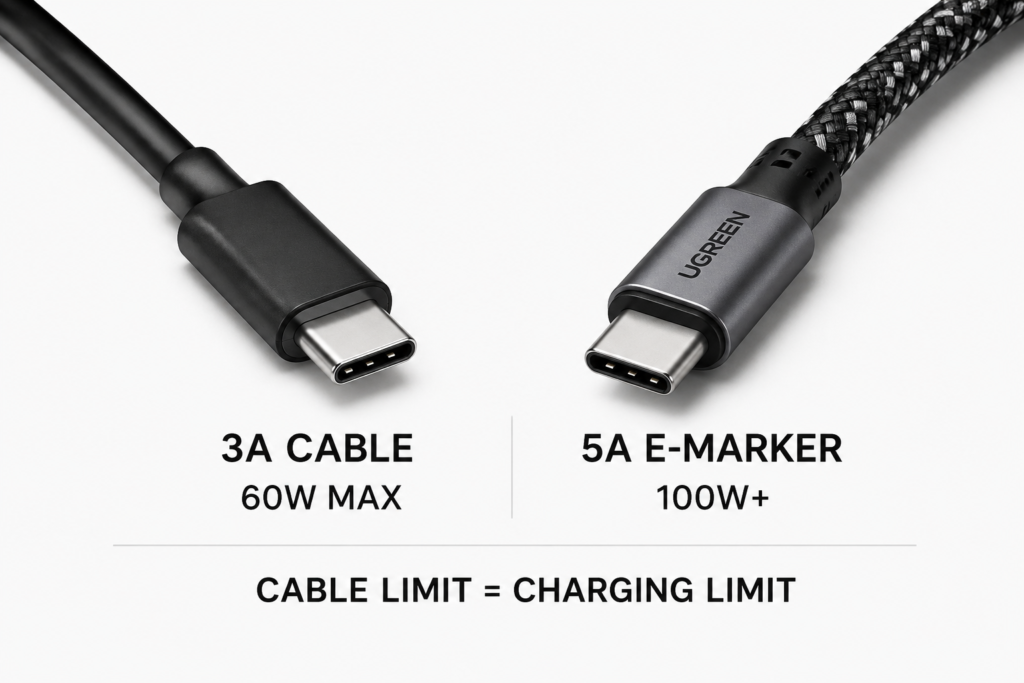
Cables are often the hidden bottleneck. There are three main power classes:
| Cable Type | Max Current | Typical Max Power | Requirement |
|---|---|---|---|
| Standard 3A cable | 3A | ~60W at 20V | No E-Marker needed |
| 5A E-Marker cable | 5A | 100W at 20V | E-Marker chip mandatory |
| PD 3.1 EPR cable | 5A | 240W at 48V | EPR-certified E-Marker |
A 100W charger paired with a basic 3A cable will never deliver more than ~60W. The charger detects the cable’s limit and reduces output accordingly.
6.3 How to Check an E-Marker Cable
A good PD power meter can read the E-Marker chip inside a cable and tell you:
- Maximum current rating (3A / 5A)
- PD revision support
- Whether it supports EPR This is the fastest way to spot a “fake 100W cable.”
7. Why Your Measured Power Is Lower Than Advertised
Seeing 60W from a 100W charger is not always a defect. Here’s what’s normal and what’s not.
7.1 Normal & Expected Losses
Charger Conversion Loss
Chargers convert AC wall power to DC USB power. No converter is 100% efficient. Quality chargers run 80–95% efficiency depending on load, voltage, and temperature.Infineon T…
Cable & Connector Loss
Thin cables, long cables, and dirty connectors cause voltage drop. At 5A, even a small resistance can waste several watts.
Device-Side Loss
Your phone/laptop has its own charging circuit. It converts the incoming voltage to match the battery’s needs, losing a little more energy in the process.
7.2 Device-Imposed Power Limits
Battery Charge Stages
- 0–50%: Full-speed constant power
- 50–80%: Gradually reducing current
- 80–100%: Trickle charging at very low power This is intentional battery protection, not a bug.
Thermal Throttling
If the battery or charger gets too warm, the device will pull less current to cool down. This is extremely common on fast-charging phones.
System Power Drain
If you’re using the device while charging, some power feeds the screen and processor instead of the battery.
7.3 Protocol & Compatibility Issues
- Protocol mismatch: A QC-only charger won’t fast-charge a PD-only phone, and vice versa.
- Missing E-Marker: The charger won’t go above 3A / 60W.
- Old firmware: Rare, but some devices have bugs that prevent full-speed negotiation.
7.4 External Factors
- Weak wall socket / loose connection: Adds resistance and reduces effective power.
- Grid voltage fluctuations: Especially noticeable on 110V grids in some regions.
8. How to Interpret Your Results
8.1 What Counts as “Normal”?
As a rule of thumb:
- Peak power ≥ 80% of advertised: Normal and expected.
- Sustained power 60–80% of advertised: Still within normal range for most consumer devices due to thermal management.
- Below 50% consistently: Something is wrong — start troubleshooting.
For example, a 65W laptop charger delivering 55–62W sustained is excellent. A 100W charger stuck at 30W is not.
8.2 The Typical Charging Power Curve
A healthy charge session follows three phases:
- Constant Power Phase (0–50%): Voltage is steady, current is high, power is near maximum.
- Constant Voltage Phase (50–80%): Voltage stays flat, current slowly drops, power decreases.
- Trickle Phase (80–100%): Current drops to a fraction of maximum, topping off the battery gently.
If your graph looks like this, your setup is working correctly.
8.3 Troubleshooting Low Power
If power is much lower than expected, check in this order:
- Protocol: Is voltage stuck at 5V? PD handshake failed.
- Cable: Swap in a known-good 5A E-Marker cable.
- Battery level: Test again at 20–50% charge.
- Temperature: Let everything cool down and retry.
- Charger port: Try a different port on multi-port chargers.
- Socket: Plug directly into a wall outlet, not a power strip.
8.4 Troubleshooting Fluctuating Power
- Normal: Small, fast wiggles from PPS/AVS adjustment.
- Abnormal: Big, irregular drops and resets. Usually caused by loose connections, dirty ports, or a faulty cable.
9. Common Mistakes & Safety Rules
9.1 Most Common Measurement Mistakes
- Judging a charger at 90% battery — of course it’s slow; it’s supposed to be.
- Confusing wall power with battery power — they are not the same number.
- Only looking at peak power — a 2-second peak doesn’t mean fast charging.
- Testing with different cables each time — you’re testing the cable, not the charger.
- Trusting software apps as ground truth — they’re estimates, not precision measurements.
9.2 Safety Rules
- Never open a charger’s AC casing. High-voltage capacitors can cause severe shock.
- Be careful with EPR voltages. 28–48V DC is more dangerous than 20V. Use only rated test equipment.
- Don’t short USB-C pins. A short can destroy your charger, meter, or device.
- Avoid high-power testing in hot environments or on flammable surfaces.
- Stop testing immediately if a cable or charger gets uncomfortably hot.
10. Frequently Asked Questions (FAQ)
Q1: Why is my 100W USB-C charger only delivering 60W?
This is almost always one of three things: your device doesn’t support more than 60W, your cable is a basic 3A model without an E-Marker chip, or the battery is already mostly full. Test at 20–50% charge with a known 5A cable first.
Q2: Will a USB power meter slow down my charging?
A well-designed passthrough meter adds negligible resistance and will not meaningfully affect charging speed. Very cheap meters with poor internal wiring can cause a small voltage drop, but quality models are essentially transparent to the PD system.
Q3: How do I test USB PD 3.1 240W charging?
You need three things: a 240W EPR charger, a USB-IF certified EPR cable, and a power meter rated for EPR voltages (up to 48V). Standard 100W meters will not work and may be damaged.
Q4: Why does my charging power keep jumping up and down?
Small fluctuations are normal — PPS and thermal management constantly adjust current. Large, erratic swings usually mean a loose connection, dirty port, or failing cable.
Q5: My phone says “fast charging” but power is low — is that normal?
Yes. “Fast charging” on the screen often just means a basic 15–18W PD mode activated. The actual peak wattage can be well below the charger’s maximum. Always verify with a meter.
Q6: Is there a difference between measuring PPS and regular PD?
The meter reads wattage the same way (V × A). The difference is that PPS voltage changes smoothly, so you’ll see the number drift up and down instead of jumping between fixed levels.
Q7: Can a damaged USB-C cable reduce charging power?
Absolutely. A worn cable with bent pins or frayed internal wires adds resistance, causing voltage drop and lower effective power. It can also overheat — replace it immediately.
Q8: Are phone software power readings accurate?
They give a rough idea and are fine for comparing chargers casually. For precise numbers, always use a hardware power meter. Software readings can be off by 10–20% or more.
11. Final Summary & Recommendations
Measuring real charging power isn’t just for tech reviewers — it’s the only way to know if you’re actually getting the speed you paid for.
Key Takeaways
- Real power = measured voltage × measured current, not the number on the box.
- A USB-C power meter is the best tool for most people. It’s cheap, easy, and accurate.
- The cable matters more than you think. A 3A cable caps any charger at ~60W.
- Sustained power beats peak power. A few seconds of high wattage doesn’t equal a fast charge.
- Lower-than-advertised power is usually normal. Losses happen at every step of the chain.
Recommended Setup by User
- Casual user: Grab a $15–$25 basic USB-C power meter. It will answer 90% of your questions.
- Tech enthusiast / laptop owner: Step up to a PD protocol analyzer with E-Marker reading.
- High-power EPR user: Buy a meter rated for 48V / 240W EPR testing.
The Golden Rule of Charging
Fast charging is a system, not a single product. The charger, cable, and device all have to agree — and your meter is the easiest way to see if they actually do.